


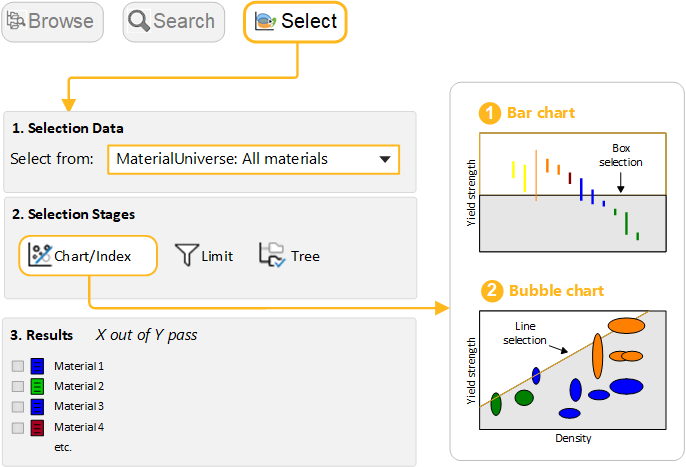
Exercise 7: Selection using a Chart Stage
Use the Index line and Box selection tools to select materials based on their attribute values.
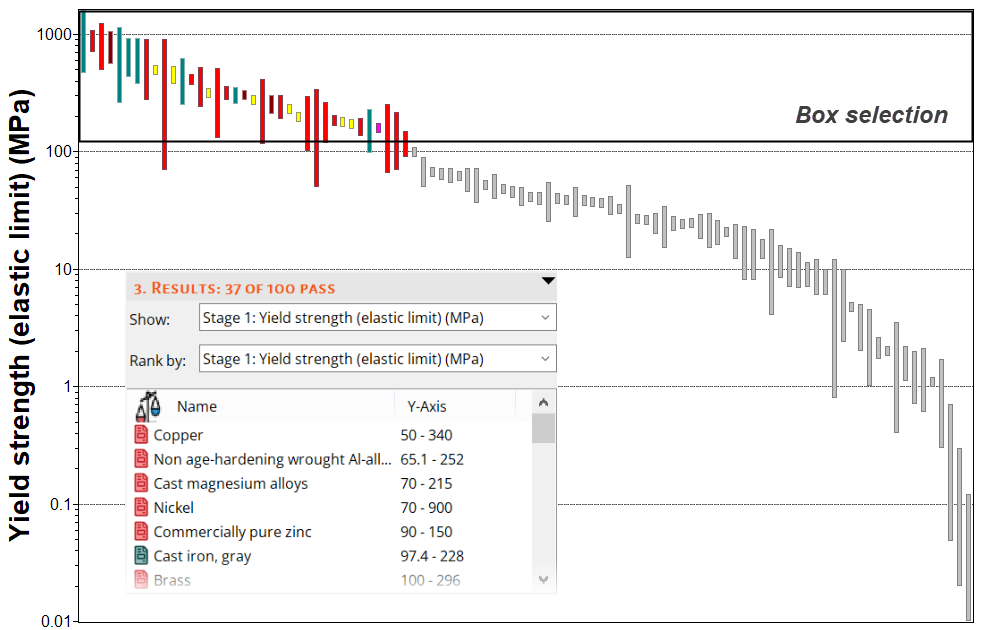
When plotted on a Chart, records can also be filtered using the Index line and Box selection tools.
-
Use a Box selection to identify materials with high
values of Yield strength
-
Click
 Box selection
, then drag to define the selection box.
Box selection
, then drag to define the selection box.
-
Click
-
Add Density (ρ) to the X-axis
-
Click
 Chart
Settings , then go to the X-Axis tab and select Density as
the X-axis attribute. You can also double-click the chart axis to open
the dialog.
Chart
Settings , then go to the X-Axis tab and select Density as
the X-axis attribute. You can also double-click the chart axis to open
the dialog.
-
Click
-
Use an Index line to identify materials with high values of specific strength,
σy / ρ
-
Click
 Index and display
lines .
Index and display
lines .
- Use the default Slope value of 1.
- The objective of the line is set to Maximize the index by default, which will result in selection of materials above the line, for high values of σy / ρ.
- Click OK, then click the chart to position the line through a particular point.
- Drag the line upwards to refine the selection to fewer materials.
-
Click
-
Delete this stage
-
Select the stage in the Selection Stages list and press
DELETE.
-
Select the stage in the Selection Stages list and press
DELETE.