Example datasets
Granta EduPack contains example datasets and tools to help you visualize difficult concepts or illustrate the effects of various processes on material properties.
Phase Diagram Tool
The Phase Diagram Tool is a series of interactive phase diagrams designed to help you learn about phase diagrams and phase transformations. The interactive diagrams are supported by a glossary and a data table of examples.
| Section | Description |
|---|---|
| Phase Diagram glossary |
The glossary consists of three binary (two component) phase diagrams.
|
| Lever Rule |
The Lever Rule diagram is an interactive, annotated phase diagram with illustrations of the alloy's phase. Mouse over the diagram to begin. Hover the mouse over different parts of the diagram to see the lever rule calculations at different temperatures. |
| Phases |
The Phases section consists of three binary (two component) phase diagrams, with illustrations of each phase at the atomic level.
|
| Cooling paths |
The Cooling paths section consists of three binary (two component) phase diagrams, with annotated and illustrated cooling paths.
|
| Phase diagram datatable |
You can use this section to test your knowledge, or as a reference. Each example in the table contains a phase diagram, a short description, and links to relevant records elsewhere in Granta EduPack. Tip: You can also Browse to these
records by selecting the Phase Diagrams
table.
|
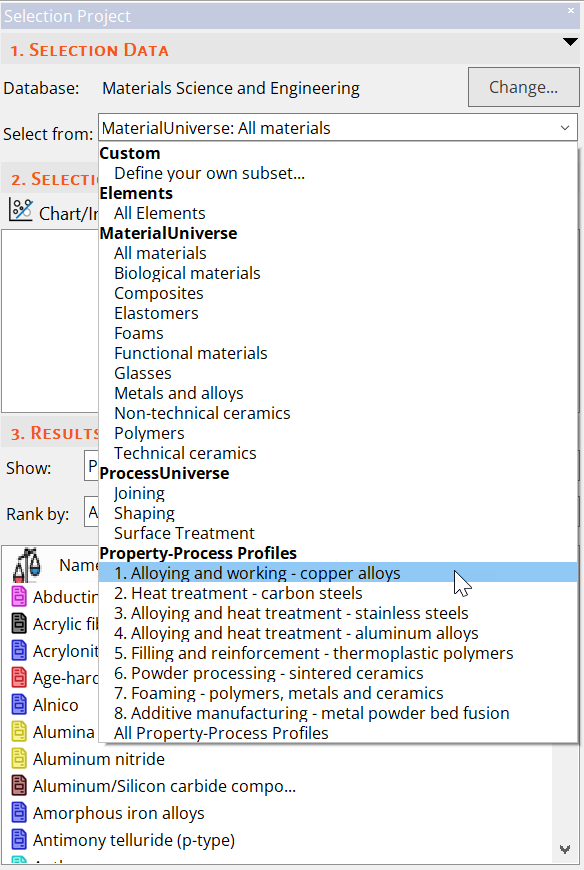
Property-Process Profiles
Property-process datasets allow you to visualize the effects of processes such as sintering and solid solution strengthening on the properties of example materials.
You can also plot property-process data in a chart by selecting a property-process profile before creating a chart.