You can annotate bubble and bar charts to identify the records and display other
information. Labels can be formatted and positioned to match your requirements.
-
To add a label to your chart:
-
With the chart open, click
 Text
label
Text
label
-
Enter the text, and click Enter.
Tip: To create a line break in a long text label, press
Shift+Enter.
-
Position the label, by dragging and dropping it.
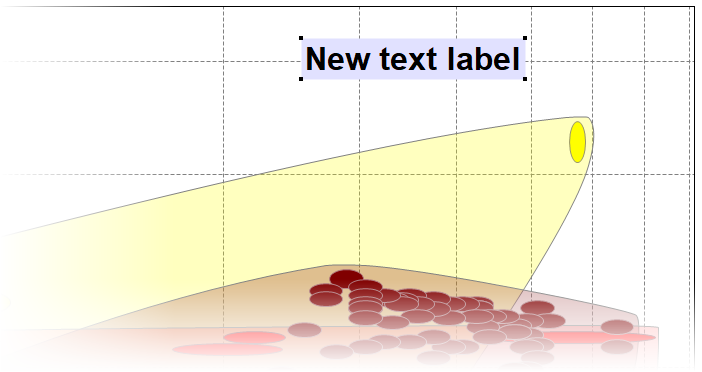
Figure 1. A chart with a text
label added.
-
To label a specific record or material family on your chart, click the required
record bubble, record bar, or family envelope.
Tip: Alternatively, right-click the record from the Browse, Search,
or Results panels, and select Label.
-
To change the position of labels on your charts, select the label, and drag it
to the new position.
-
To change the format, select the label, right-click and select
Format Label, you can change:
| Option | Description |
|---|
| Font |
Change the Font used, the style of that font, and the text
size. |
| Text Color |
The color of the font. |
| Fill Color |
The color of the label background. |
| Border Color |
The color of the border around the label. |
| Rounded Corners |
Whether to round the corners of the label. |
-
To change the text of a label, select the label, right-click and select
Rename
If a record label is renamed, then the new name will apply to other new
labels for the same record on all other charts within the same project. This
is useful for adding specific tradenames to frequently-used material
labels.
Tip:
- If you have renamed a data label, you can change the label to
display the default name of the record. Select the label,
right-click and select Default Name.
- To create a line break in a long text label, press
Shift+Enter.


