


Editing the chart axis settings
The X-Axis and Y-Axis tabs for chart stages specify the settings for the chart axes.
To edit the chart axis settings:
-
Click
 Stage Settings on the Chart
stage toolbar.
Stage Settings on the Chart
stage toolbar.
- Edit the settings you require.
-
In the X-axis and Y-axis tabs, you can change the axis settings:
-
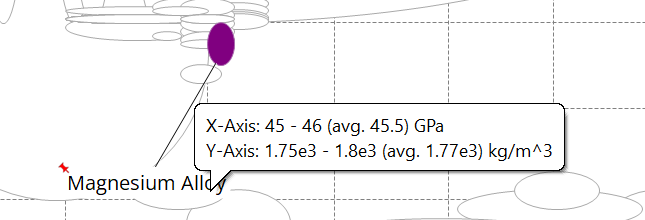
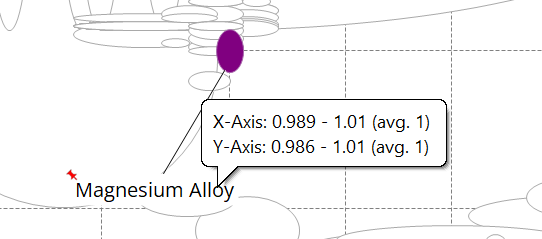
Absolute values / Relative values: If a reference record has been set, you
can select Absolute values to display values on
the chart as absolute numerical values, or select Relative
values to display values relative to the reference record,
so that the chart is plotted with the reference record at (1,1). This
allows easy comparison of other material records to the reference
record.
-
Absolute values / Relative values: If a reference record has been set, you
can select Absolute values to display values on
the chart as absolute numerical values, or select Relative
values to display values relative to the reference record,
so that the chart is plotted with the reference record at (1,1). This
allows easy comparison of other material records to the reference
record.