

Reports page features
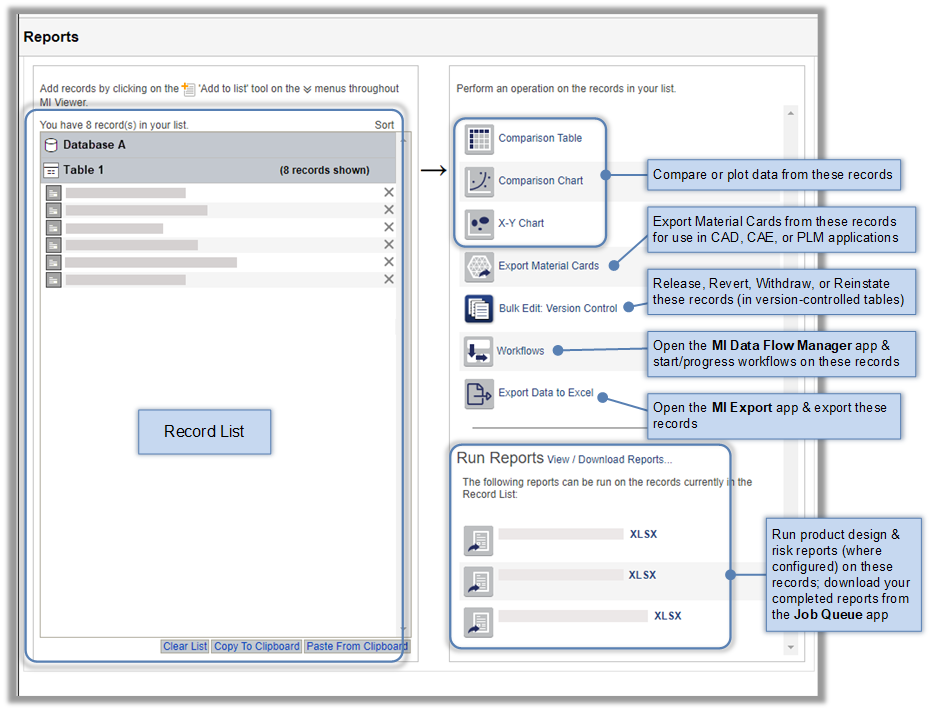
The Reports page in MI Viewer provides tools for comparing, plotting, and exporting data from the records in the Record List, and for creating analysis reports.
To view the Reports page, click Reports on the application toolbar.
Record List
On the left of the Report page is the Record List - this is a list of the records containing the data you want to compare, plot, export, or analyze. You can add records to this list in a number of different ways. See Adding records to the Record List; Copying the Record List to the clipboard.
Reporting tools
The tools that you can see on the Reports page will depend on the records currently in the Record list.
 |
View a side-by-side comparison of data from the records in the Record List. See Comparison Tables. |
 |
Plot curves and scatter points for functional data from the records in the Record List. See Comparison Charts. |
 |
Plot the relationship between two Attributes for the records in the Record List. See X-Y Charts. |
 |
Export material card information from the records in the Record List. See Exporting Material Cards. |
 |
Opens the MI Export app in a new browser tab, where you can export data from the records in the Record List to Excel. |
Other tools
In version-controlled tables, users with Administrative privileges will also see a Bulk Edit: Version Control tool, on the Reports page, which can be used to change the version control state of the records in the Record List.