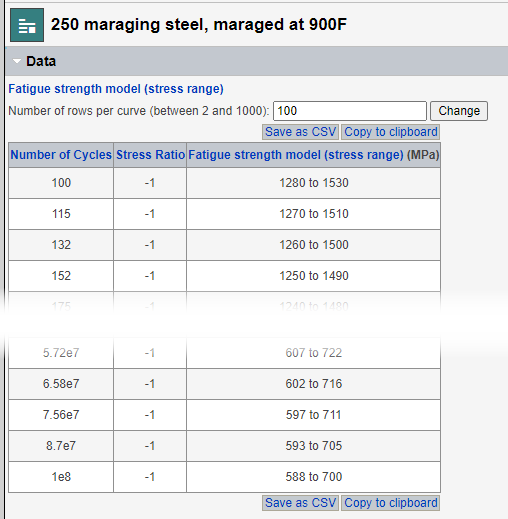
Viewing the data points
You can view a table of the data points calculated at a specified number of points along the curve.
-
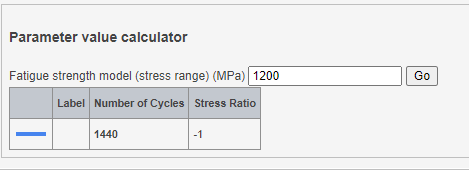
To view the calculated parameter (X-axis) value corresponding to a given Y-axis
value, enter the value of interest in the Parameter value
calculator section and click Go.
A table appears showing the calculated (X-axis) value on each curve for the specified value