
Viewing the S, Y, or Z Matrix for a Selected Frequency
Follow this procedure to view the S, Y or Z matrix:
- On the NDE ribbon, use the Parameter type drop-down menu to select S parameter, Y parameter, or Z parameter.
- Click Matrix.
- In the Cell and Frequency Selection pane, select frequencies to display.
- On the NDE ribbon, select the Table check box. The S, Y, or Z matrix appears.
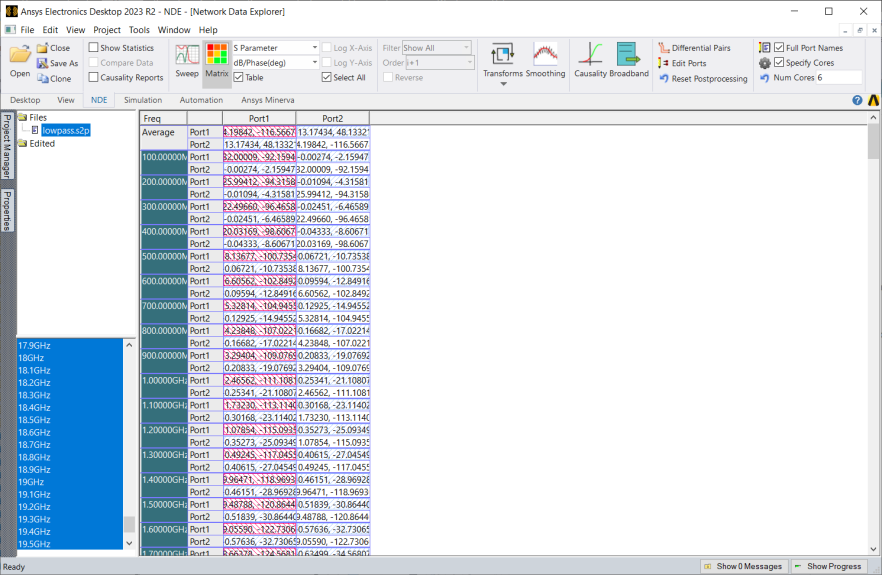
Maximum values are highlighted in red stripes. If Select Transpose is enabled, transposes are highlighted in red stripes as well.
Minimum values are highlighted in blue stripes.
Selected cells appear in solid blue. Select Select Transpose to display the transpose in blue as well.
Double-click a cell to switch to a matrix cell view, in which values for all frequencies for that cell are displayed. The double-clicked frequency is highlighted with solid red shading
Complex values are compared using their modulus. When multiple frequencies or variations are selected, the data display depends on the Multiple Frequency Statistics setting.