Displaying a Graph of a Cell Across All Frequencies
Network Data Explorer can plot a cell across all frequencies.
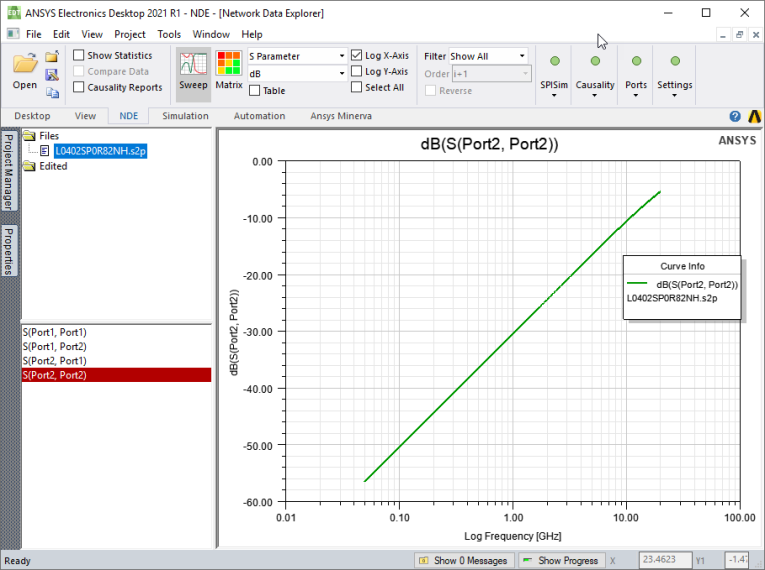
- On the NDE ribbon, select the Parameter type drop-down menu and choose S parameter, Y parameter, or Z parameter.
- Click Sweep. The Data View pane updates if necessary.
- In the Cell and Frequency Selection pane, select frequencies to display.
- To add a log scale to the X-axis, click Log X-Axis on the NDE ribbon.
- To add a log scale to the Y-axis, click Log Y-Axis on the NDE ribbon.