
Displaying Statistics by Frequency
Network Data Explorer can display various statistical measurements.
- On the NDE ribbon, click Matrix.
- Click Table.
- Click Show Statistics.
- In the Cell and Frequency Selection pane, select frequencies to display.
- To change the statistics displayed, use the populated list to select statistics.
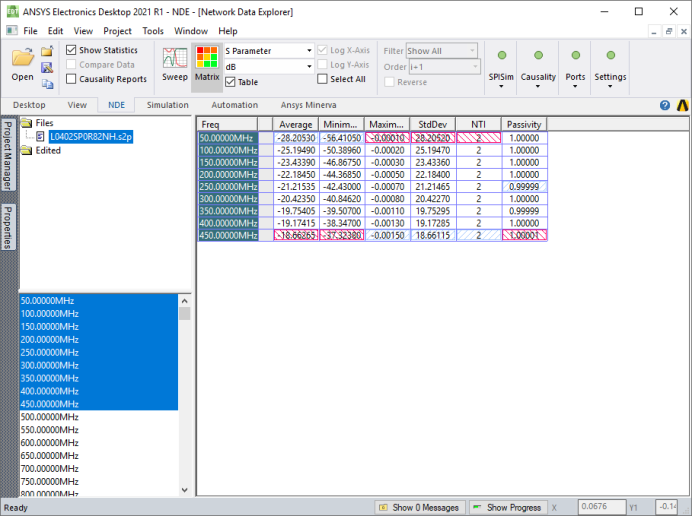
The various statistical measures for the current Parametertype and Format display for each frequency selected. Only real (not complex) data formats are offered for statistical analysis. Passivity is only available for S-parameter data (comparisons inactive). NTI refers to the number of trivial items. For S-parameters, this includes all zeros and ones; for all other data (and data comparisons), only zeros count as trivial. The minimum value for each column is highlighted in blue; the maximum is highlighted in red.
When you hover the cursor over a cell, a tooltip indicates the frequency and statistics displayed. Click a cell to select it. Multiple variations display as separate entries in the table; use the tooltip to identify the variation for a particular frequency.
Click a column header to sort the data using that column for comparison.