
Displaying Individual Statistics for All Frequencies
Network Data Explorer can display various statistical measurements.
- On the NDE ribbon, click Sweep.
- Click Table.
- Click Show Statistics.
- In the Cell and Frequency Selection pane, select frequencies to display. The information displays in a table in the Data View pane.
- To change the statistics displayed, use the populated list to select statistics.
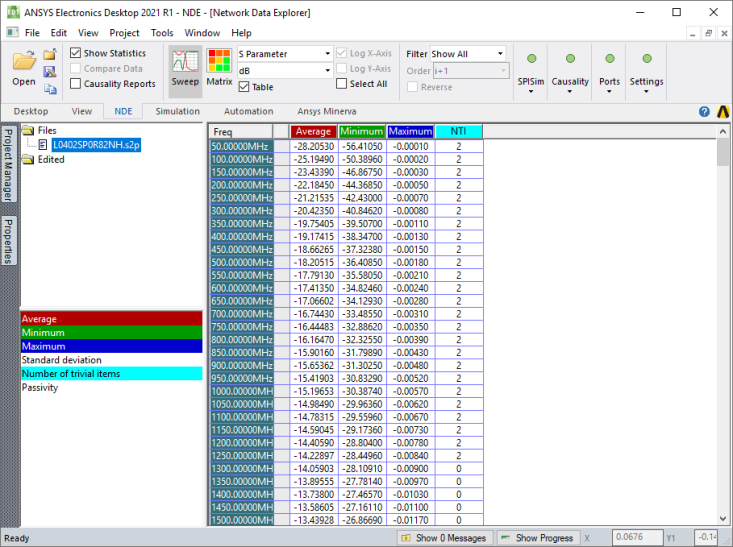
The various statistical measures (for the current Parametertype and Format) are displayed for all frequencies. Passivity is only available for S-parameters (comparisons inactive). NTI refers to the number of trivial items. For S-parameters, this includes all zeros and ones; for all other data (and data comparisons), only zeros count as trivial.
When you hover the cursor over a cell, a tooltip indicates the frequency and statistics displayed. Click a cell to select it. Multiple variations display as separate entries in the table; use the tooltip to identify the variation for a particular frequency.
Select Plot in the data view pane to switch the view to a graph of the statistical data. The graph shares the same color coding as the columns; highlighted columns are highlighted in the plot.