
Creating a Statistics Plot
Network Data Explorer can display a graph of selected statistical measures across all frequencies.
- On the NDE ribbon, click Sweep.
- Click Show Statistics.
- In the Cell and Frequency Selection pane, select statistics to display. The selected statistics are plotted.
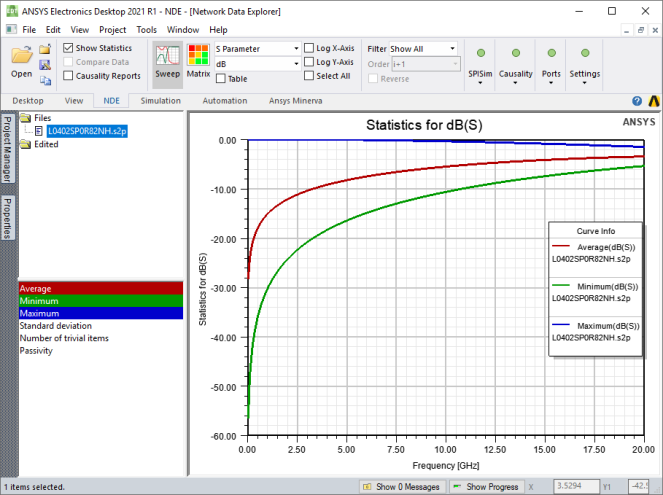
Hover the cursor over a statistic to view more information about it.
Passivity is only available for S-parameters (comparisons inactive).
For S-parameters, the Number of Trivial Items (NTI) includes all values of 0 and 1. For other data and data comparisons, only values of 0 are counted as trivial.