
Controlling Visual Detail in a 3D Rectangular Plot
If a particular plot seems busy with information, you can edit plot properties, such as axis and grid attributes, for discrete levels of visual detail to improve readability. Double-click anywhere on a plot to display the Properties dialog box. The Visual Detail property on the General tab also provides control suited to different screen and plot sizes.
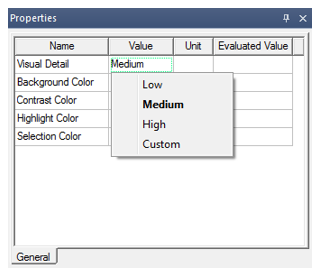
The Visual Detail menu has four options: Low, Medium, High, and Custom. If you select any visual detail, the 3D plot renders according to the selected visual detail level and the properties reflect the values chosen for the selected visual detail level. From this predefined visual detail level, if you modify any properties, Visual Detail is set to Custom (or to another predefined visual detail level if the edits happen to match the settings for that level).
You can also manually set Visual Detail to Custom. In such a case, Custom will inherit property values corresponding to the previous level. This ensures that you can customize settings starting from a baseline provided by the preconfigured Low, Medium, or High visual detail levels.
3D Rectangular Plot with Medium Visual Detail
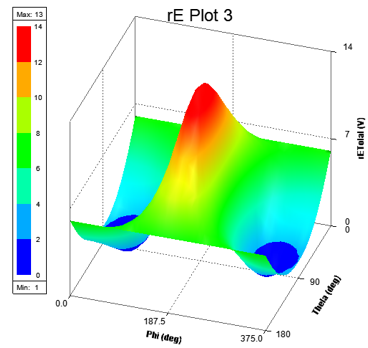
On creation, a 3D rectangular plot has Visual Detail set to Medium and looks and feels as shown above. Specifically, under medium visual detail level, a 3D rectangular plot has 3 ticks per axis (X-, Y-, Z-axis) which will show minimum, maximum, and middle value. This setting also shows axes labels.
3D Rectangular Plot with Low Visual Detail

With Visual Detail set to Low, a 3D rectangular plot shows axes with two ticks corresponding to minimum and maximum values. It also shows axes labels and grid borders.
3D Rectangular Plot with High Visual Detail
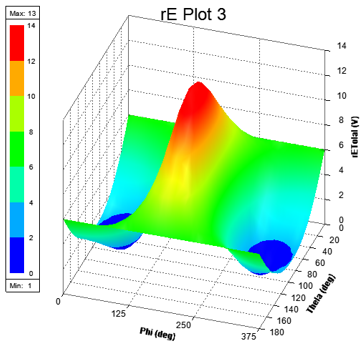
With Visual Detail set to High, a 3D rectangular plot shows all Cartesian axes and grids together with all ticks and axes labels.
Axis Properties: Ticks Specification and Num. Ticks
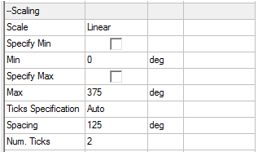
Ticks Specification is available on axis properties, as shown below:
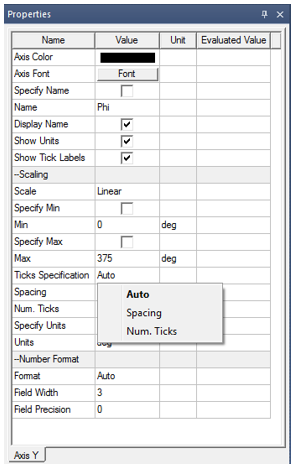
The Ticks Specification menu contains the Auto, Spacing, and Num. Ticks values. If Ticks Specification is Auto, then a spacing value is calculated and used to calculate and display the tick labels. Spacing shows the calculated value, and Num. Ticks shows the number of ticks based on this spacing value as shown below:
You can edit the Spacing field when Ticks Specification is set to Spacing; otherwise, it is read-only.
You can edit the Num. Ticks field when Ticks Specification is Num. Ticks; otherwise, it is read-only.
Valid Num. Ticks values are 0 to 100. If you enter an invalid value, an error message displays. If you enter a spacing value that results in number of ticks greater than 100, then an appropriate value is shown.
- If Num. Ticks is 0, then no ticks appear on the axis.
- If Num. Ticks is 1, then only the maximum value tick appears on the axis.
- If Num. Ticks is 2, then only the minimum and maximum value ticks appear on the axis.
- If Num. Ticks is greater than 2, then evenly spaced ticks (including minimum and maximum) appear on the axis.
With the addition of the Ticks Specification property to axis properties, the Specify Spacing property was removed as an axis property.
-
When you open an R18.0 or R18.1 project with the Specify Spacing check box cleared, Ticks Specification is set to Auto.
-
When you open an R18.0 or R18.1 project with the Specify Spacing check box selected, Ticks Specification is set to Spacing.