
Creating a Modal Report
Data Table Example:
- Access the Report dialog box using one of the following three methods:
- On the Results ribbon tab, click
 Modal Report >
  Data Table.
 - Using the menu bar, click Mechanical > Results > Create Modal Report > Data Table.
- Right-click Results in the Project Manager and choose Create Modal Report > Data Table from the shortcut menu.
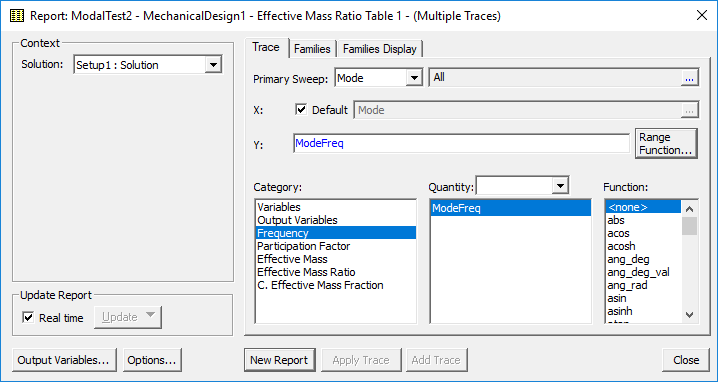
- Select the desired Solution, Category, and Quantity or Quantities to tabulate.
- Click New Report but keep the Report dialog box open.
- To add additional results to the current report, select the desired Category and Quantities in the Report dialog box.
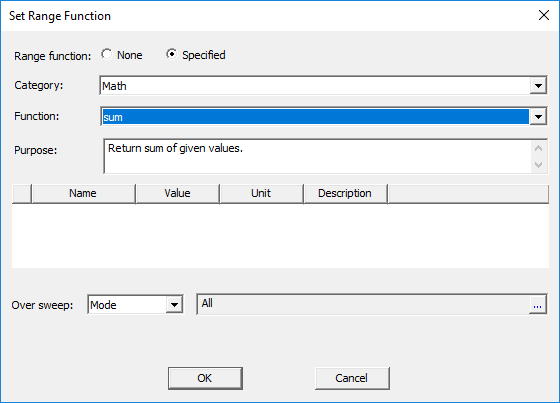
- Optionally, click Range Function to define a mathematical operation to perform on the specified results. Then:
- Choose the Category and Function to apply to the selected quantities from the drop-down menus.
- Click OK to apply the operation and close the Set Range Function dialog box.
- Click Add Trace and Close.
- Customize the table as follows:
- Click on the Mode column header.
- In the Data Filter tab of the docked Properties window, change the Number Format to Integer.
- Click on the ModeFreq[Hz] column header.
- In the Data Filter tab of the docked Properties window, change the Field Precision to 2.
- Click and drag the column borders to customize the column widths.
The following report setup example shows the settings to tabulate the Mode Frequencies.
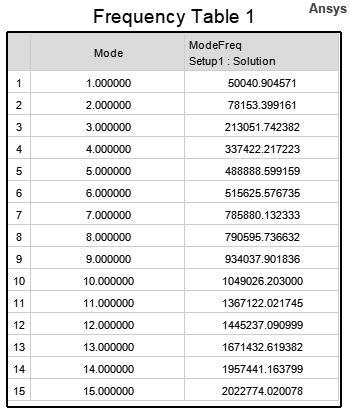
The table appears in a new window. The following data table example is consistent with the Report dialog box settings shown under step 2:
The following sample report setup will add effective mass ratio results to the current report:

The following example shows the mathematical sum function being applied to the specified quantities. The sum will include the contribution of all modes and will be applied separately to each degree of freedom:
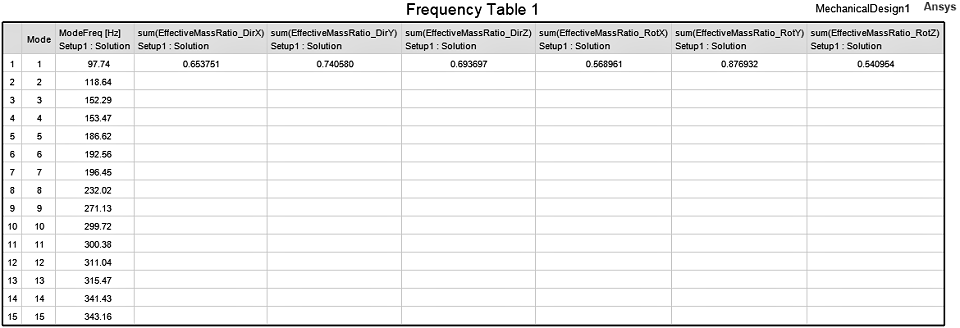
Six columns are added to the Frequency Table. Though the effective mass ratio sums are listed in the Mode 1 row, the numbers are the total for all calculated modes.
The sample table with the described customizations is shown below:
2D (Rectangular) or Stacked Plot Example:
- Access the Report dialog box using one of the following three methods:
- On the Results ribbon tab, click Modal Report >
 2D or
2D or  Stacked.
 - Using the menu bar, click Mechanical > Results > Create Modal Report > Rectangular Plot or Rectangular Stacked Plot.
- Right-click Results in the Project Manager and choose Create Modal Report > Rectangular Plot or Rectangular Stacked Plot from the shortcut menu.
- Select the desired Solution, Category, and Quantity or Quantities plot.
- Click New Report.
- Optionally, repeat steps 2 and 3 to add more traces to the current plot. Otherwise, click Close.
- Your plot will initially appear as one or more continuous traces. Make the following changes to produce a plot more suited to modal results:
- In the plot window, click one of the traces to select it. Also, if there are multiple traces, press Ctrl+A to select all of the remaining traces too.
The trace settings appear in the docked Properties window.
- In the Attribute tab of the docked Properties window, change the Trace Type to one of the following options that are more suitable for plotting modal results:
- Discrete
- Stick Zero
- Stick Infinity
- Bar Zero
- Bar Infinity
- Step
- In the plot window, click the X axis to adjust its settings.
- In the Axis tab of the docked Properties window, change the Number Format to Integer.
- Click in the plot window background area to deselect the axis.
The following report setup example shows the settings to plot the Effective Mass Ratios for all six degrees of freedom:
The following example is a 2D plot of the Effective Mass Ratio in all directions for 30 modes. The Trace Type was set to Bar Infinity:
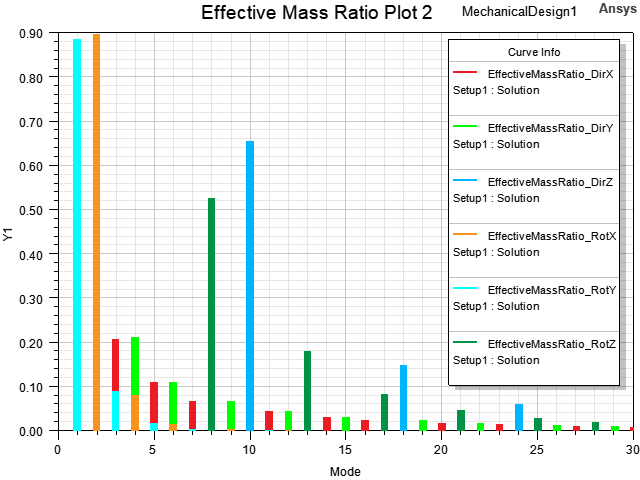
This plot gives you a quick visual indication of which translational or rotational mass participation is the most significant for each mode. For example, mode 2 has the greatest effective mass ratio in the X rotational direction, mode 1 in the Y rotational direction, mode 10 in the Z translational direction, and mode 8 in the Z rotational direction. Those are the top four modes most likely to be excited by ground vibration at the corresponding mode frequencies.