Monitoring the Solution Process
While a simulation is running, you can monitor the solution's progress in the Progress window. The progress bar shows the relative progress of the simulation.
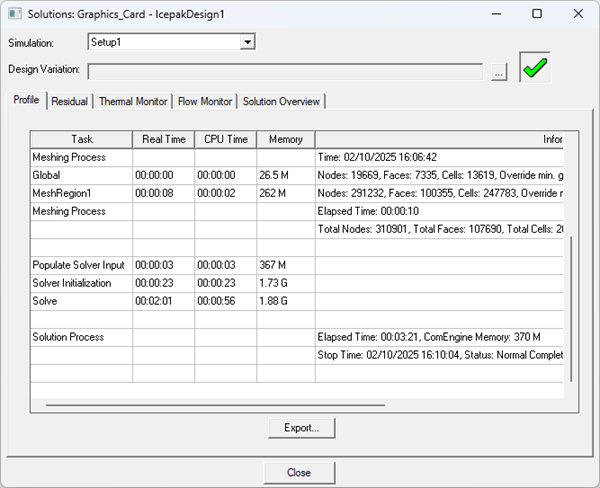
You can also view a profile of the simulation as well as convergence data during or after the solution process.
- The solution profile includes meshing information (memory, times, and mesh counts per region), solver times (input, initialization, and solve), surface and volume EM loss data, exported AC loss data from HFSS 3D Layout, and total solution process.
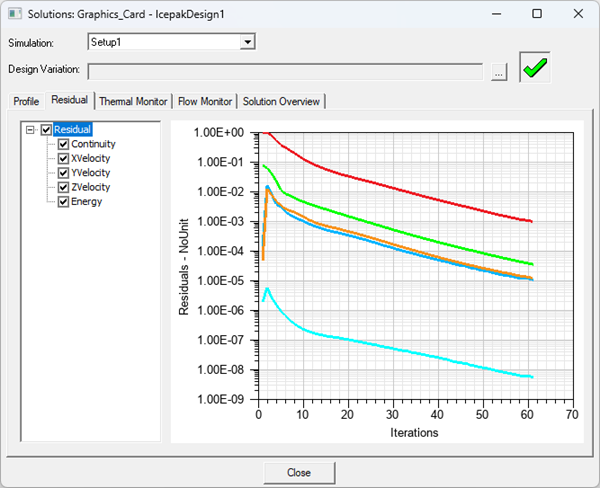
- The solution residuals include those for continuity, velocity, energy, and joule heating (if enabled).
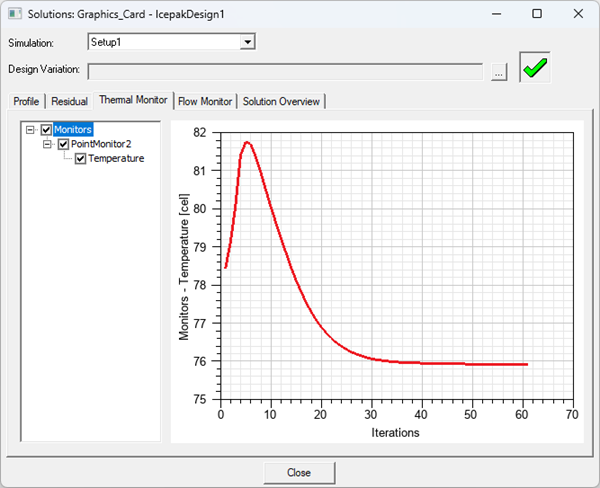
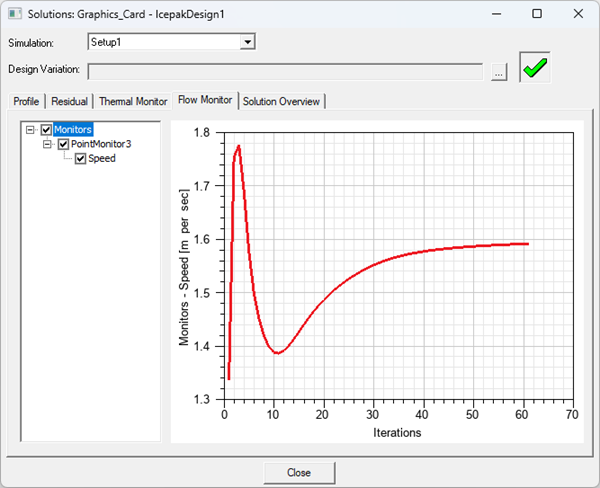
- The solution monitor includes data plotted for any defined thermal and flow monitor points.
- The solution overview includes thermal and flow data for boundary conditions and fan components.Note:
For solution overviews, Heatsink, PCB, CTM, and 3D-IC components are not currently supported.
To view the solution data:
- In the Project Manager, expand Analysis.
- Right-click the solution setup and select Profile, Residual, Thermal Monitor, Flow Monitor, or Solution Overview.
- In the Solutions dialog box, toggle between the Profile, Residual, Thermal Monitor, Flow Monitor, and Solution Overview tabs to view the information. See Solution Overview for details on the data displayed on the Thermal, Flow, and Fan tabs.
- For Parametric trials, click [...] next to Design Variation to open the Set Design Variation dialog box and choose the variation for which to display data.
Solution Overview
The solution overview has the following limitations:
- When Mesh Fusion is enabled, the solution overview may report incorrect values (partial results) for some or all boundary conditions.
- The solution overview does not report values based on full mesh. It reports values based on reduced mesh, so results may be incomplete in some instances. It is recommended to use a Fields Summary report to review the results in such instances.
The solution overview has three tabs that display thermal, flow, and fan data. Toggle between the Thermal, Flow, and Fan tabs to view the information. Click Export to generate a plain text (.txt) file containing the data. For parametric trials, click [...] next to Design Variation to open the Set Design Variation dialog box and choose the variation for which to display data.
Data in the solution overview is cleared if you delete a boundary condition or component in the report or if you clean up solution data.
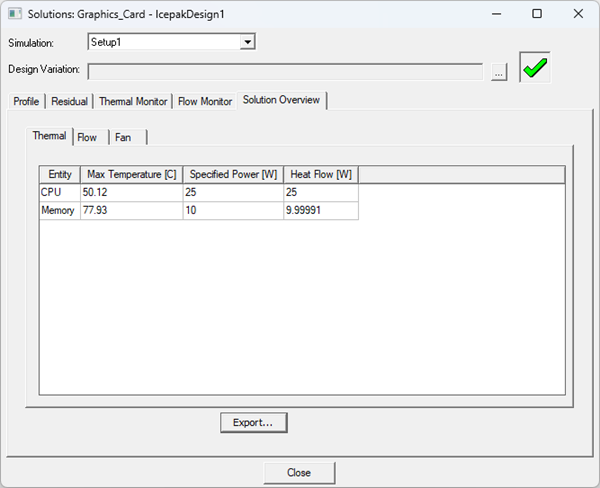
Thermal Tab
The Thermal tab displays data for boundary conditions, including Blocks, Networks, Plates, Sources, Em Losses, Resistances, and Walls. Data is also displayed for external 3D components with supported thermal boundary conditions.
- Max Temperature
- Specified Power
Note:
If a dataset is used to specify power, a default value of zero is displayed.
- Heat Flow
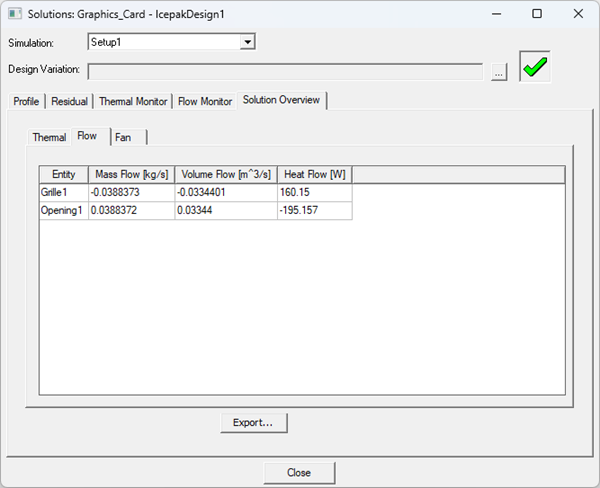
Flow Tab
The Flow tab displays data for boundary conditions, including Openings, Grilles, and Blowers. Data is also displayed for external 3D components with supported flow boundary conditions.
- Mass Flow
- Volume Flow
- Heat Flow
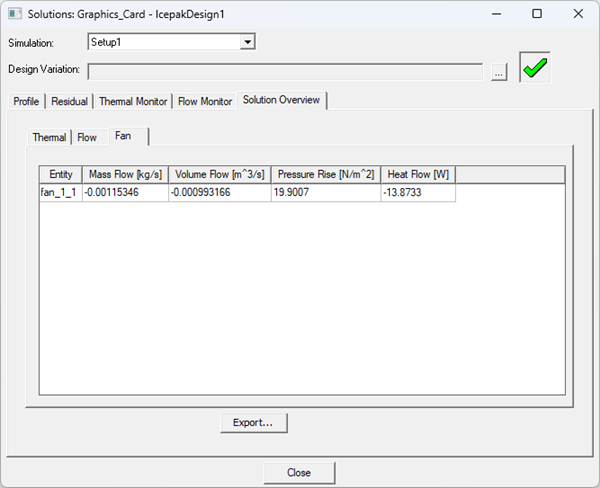
Fan Tab
The Fan tab displays data for fan components in the design (if any). Data is also displayed for external 3D components with fan components.
- Mass Flow
- Volume Flow
- Pressure Rise
- Heat Flow