
Modifying Field Plot Colors
- Click
 Modify Plot Attributes or, in the Project Manager, right-click Field Overlays and select Modify Plots from the short-cut menu (or use the "m" hotkey).
The Select Plot Folder dialog box appears.
- Select the plot folder you want to modify and click OK.
All plots in the selected folder will be modified.
A dialog box with attribute settings for the selected folder appears.
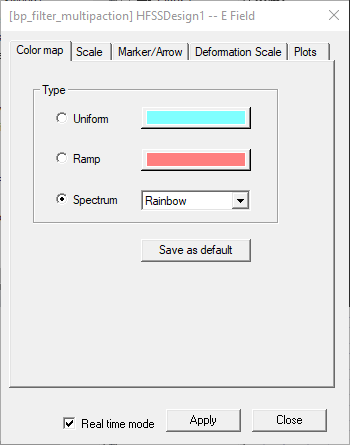
- Click the Color Map tab.
- Select one of the following color types:
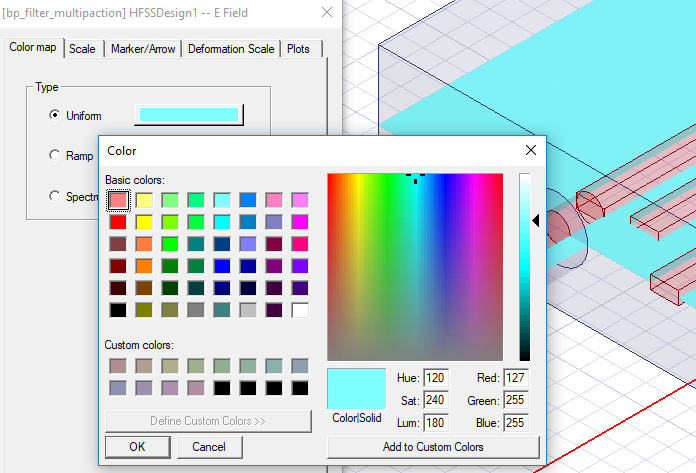
Uniform
Field quantities are plotted in a single color. Click the button to choose the plot color from the Color button palette.
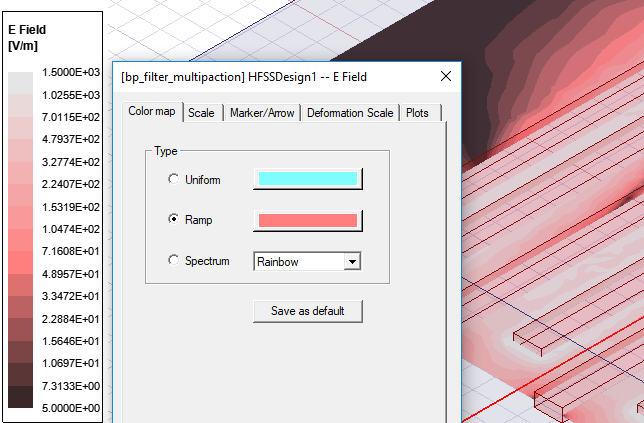
Ramp
Field quantities are plotted in shades of a single color. Choose the plot color from the Color palette. The shade of the color corresponds to its field value.
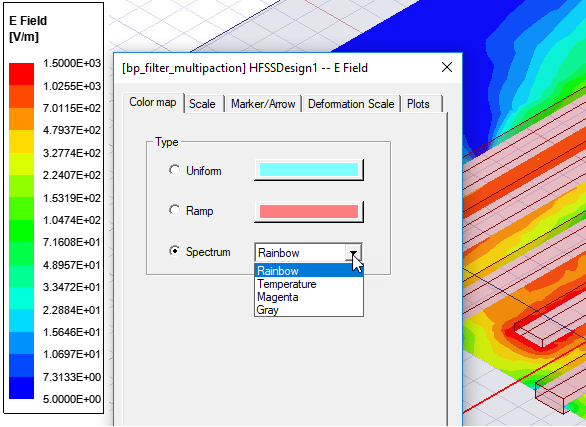
Spectrum
Field quantities are plotted in multiple colors. Choose a color spectrum from the drop-down menu. The values are Rainbow, Temperature, Magenta, and Grey. Each field value is assigned a color from the selected spectrum.
You can choose Save as Default, if you want to use the current settings.
Select Real time mode if you want these, or subsequent changes to take effect immediately in the view window.
If this option is cleared, click Apply when you want to see the changes.
- Click the Scale Tab.
- In the Num. Divisions field, enter the number of colors to use in the plot.
You can choose Save as Default, if you want to use the current settings.
Select Real time mode if you want the changes to take effect immediately in the view window.
If this option is cleared, click Apply when you want to see the changes.
- Click Close to dismiss the dialog box.