
Debye Materials
If the material is a lossy dielectric with a lower frequency near DC, use the Loss Model Material Input dialog box to specify the material's conductivity at DC or, if you prefer, its loss tangent value at the lower frequency. HFSS also enables you to specify the lossy dielectric material's high frequency/optical permittivity.
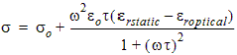
In materials commonly encountered in microwave applications ion and dipole polarization dominate. These polarization types can be described by Debye's relaxation polarization model:
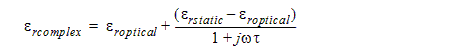
where
t = the relaxation time.
erstatic= the static permittivity.
eroptical = the high frequency/optical permittivity.
HFSS uses the values you specify in the Loss Model Material Input dialog box in Debye's equation above to determine the relative permittivity at any frequency.
Debye's model is valid for most microwave applications. If the frequency exceeds the limit of Debye's model, other models that take atomic and electron polarization into account are available.
Frequency-dependent materials are appropriate for problems solved using a discrete or interpolating sweep. In a fast sweep, frequency dependent material properties are evaluated at the center frequency which may result in less accurate results at the sweep extremes, depending on the sweep range and frequency dependence of material property.
In the simulation of high speed connectors or PCB boards, it is important to take the losses into account. Especially, in the case of transient analysis, where the improper specification of the frequency dependence of the materials would lead to unphysical results. This section discusses the loss mechanism of dielectric materials. Magnetic losses could also be taken into account, but materials commonly encountered in these applications are non-magnetic.
A lossy dielectric material is characterized by two measured values at a certain frequency: dielectric constant er and loss tangent tgd. There are two problems with the specification of the frequency dependence of dielectric materials:
- The frequency range, in which the solution has to be calculated, is much wider than the range where measured material data are available. It is very common to have just two measured points. A low frequency point, which can be taken as DC value and a higher frequency point, which serves to describe the behavior of the material at high frequency. The question arises: What is an appropriate model across the measured range as well as outside the measured range?
- A measurement always suffers from errors. If the measured data are not consistent, it could cause unphysical effects during the time domain analysis. A question arises again: how to check whether the measured data are consistent, and how to adjust them if they are not.
To answer the questions raised we need to discusses the polarization loss mechanism of dielectric materials.
Figure 1 shows the different polarization mechanisms occur in the frequency domain. It can be seen from the figure that up to the microwave region, ion and dipole polarization dominate. These polarization types can be described by Debye's relaxation polarization model:
| 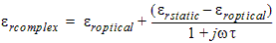 | (1) |
where
t is the relaxation time,erstatic,and eroptical are the static and high frequency permittivity, respectively. Debye's model is valid for the most of microwave applications. If the frequency exceeds the limit of Debye's model, there exists other models which take the atomic and electron polarization into account [1].
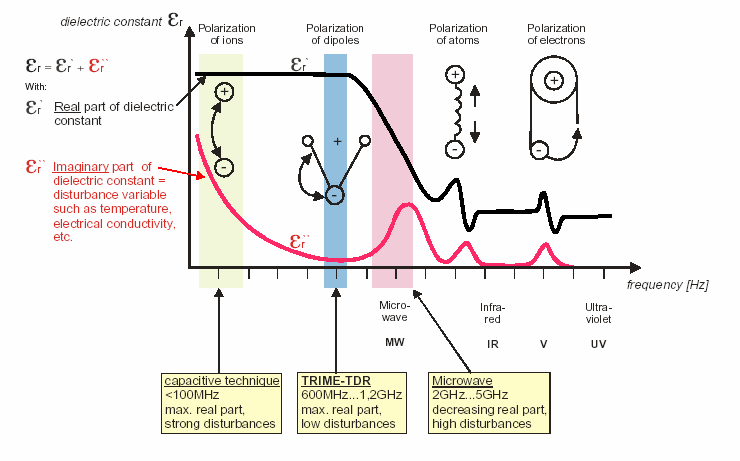
Figure 1: Polarization mechanisms
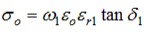
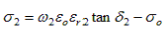
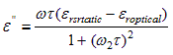
The question is now how to fit Debye's model to the actual material characteristics. In order to do this, let us express the real part of the dielectric constant and the conductivity from Eq. (1):
| 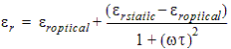 | (2) |
|  | (3) |
where
so is the DC conductivity.
Eqs (2) and (3) have 4 parameters: so, erstatic, eroptical and t.
Usually, measured data are available at two frequencies for a regular material. The measured data are the dielectric constant and the loss tangent. One set of the measured data is at low frequency
( ,
, ) and the other
set is at higher frequency (
) and the other
set is at higher frequency (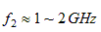 ,
, ).
).
The static or dc values can be considered as the low frequency measured data. So,
|  | (4) |
and
|  | (5) |
The critical need is to predict the high frequency behavior of the material.
If we know eroptical from measurement, the high frequency behavior of Debye's model is set. We just need to calculate the relaxation time as:
| 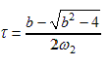 | (6) |
where
| 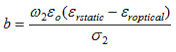 | (7) |
and
|  | (8) |
Knowing t, Eqs. (2) and (3) prescribe the material characteristic in the whole frequency region.
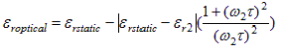
If we do not know eroptical , it can be calculated by simultaneously solving the following two equations to get eroptical and t:
| 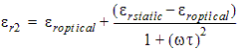 | (9) |
|
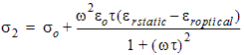 | (10) |
where er2 is measured and s2is determined by Eq.(8).
Solving equations (9) and (10), we get:
| 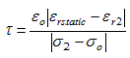 | (11) |
This method also yields the parameters of the Debye's model, but the accuracy of the method, especially at high frequencies, depends on the accuracy and the consistency of the measurement at
frequency f2.
Typical Debye's model material characteristics can be seen in Fig. 2, where e' = er.
|  | (12) |
|  | (13) |
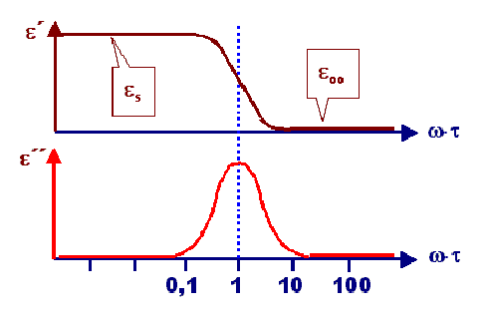
Figure 2: Material characteristics of a Debye model
The model was verified by using a double strip line filled by FR4 material. A 10 mils section of the line was modeled by HFSS and de-embedded into a 34 inch long line. The structure of HFSS model can be seen in Fig. 3.
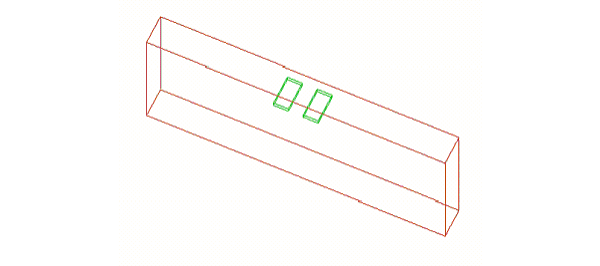
Figure 3: A 10 mils long structure of a double strip line
The input data panel of HFSS for FR4 can be seen in Fig. 4:
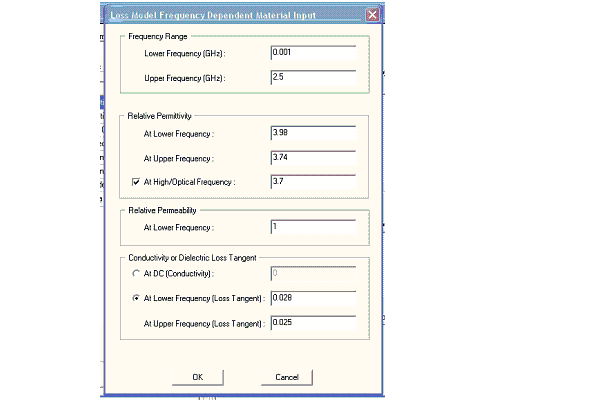
Figure 4: Input data panel for FR4 material in HFSS
It can be seen from the panel that:
 |  |  |  |
The calculated and measured frequency response of S12 can be seen in Fig. 5. The agreement between the calculated and measured values is good.
The transient response of the line to an input pulse also has been calculated. The schematic arrangement of the model in Maxwell Spice is shown in Fig. 6. The output signal is plotted in Fig. 7. The green curve is the transient response of an ideal reference line (lossless) of the same length.
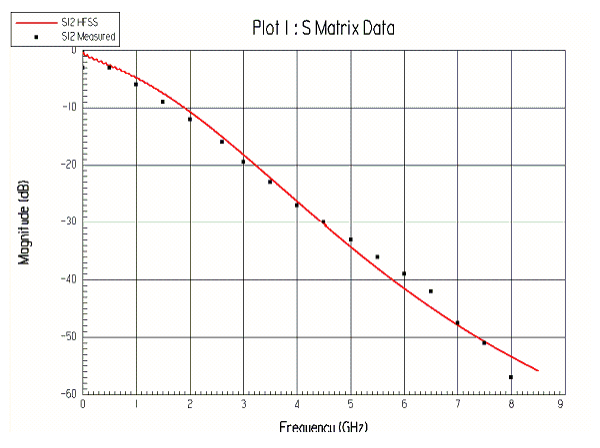
Figure 5: Calculated and measured frequency response of S12
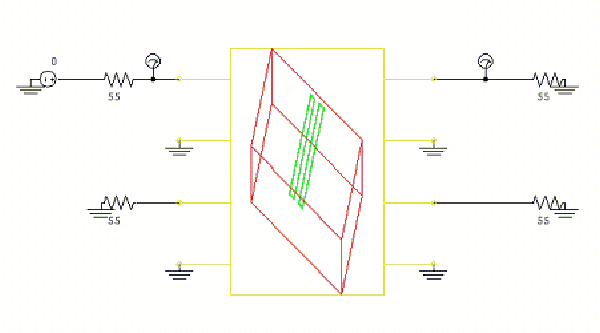
Figure 6: Schematic arrangement in Maxwell Spice
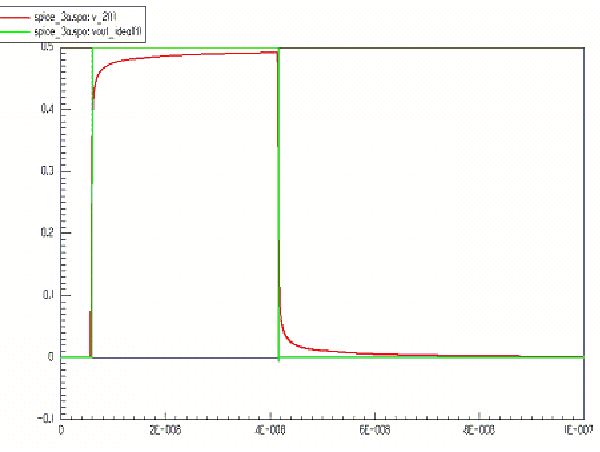
Figure 7: Transient response by Maxwell Spice
Debye's material loss model predicts the dielectric losses in the whole frequency range within an acceptable accuracy. The model can be set up by using low frequency and higher frequency measured dielectric constants and loss tangents and the optical dielectric constant. If the latter is not available, the model might be less accurate at high frequencies. Using Debye's model, no unphysical phenomena can be observed at the transient response.
References
[1] E.U. Condon and Hugh Odishaw, Handbook of Physics, McGraw Hill Book Company, Inc., New York Toronto London, 1958. Pp. 4-113 - 4-119.
[2] G.R. Strobl, The Physics of Polymers, Chapter 5, 2nd Ed. Springer, NY, 1977.