Circuit Statistical Eye Plot
Note: Statistical Eye Plots are intensity plots of Probability Mass Function (PMF) data. For bit-by-bit analyses (transient, QuickEye, AMI) the PMF data is computed on the waveform generated for the given bit pattern, and the inner eye contour of the plot corresponds to the worst-case eye for that bit pattern. Inner eye contours on Statistical Eye Plots are not BER contours.Contour plots provide BER contours.
To display a statistical eye plot of the transient, QuickEye, or AMI results after a successful analysis:
- Click Product > Results or, on the Project Manager window, expand the Project Tree and [active design folder], then right-click Results. Navigate to the appropriate report type. Then select Statistical Eye Plot to open the New Report window.
- Select the output quantities of interest and click Add Trace.
- Click Done. A Report window opens to display a graph of the analysis results.
A Statistical Eye Plot resembles the following: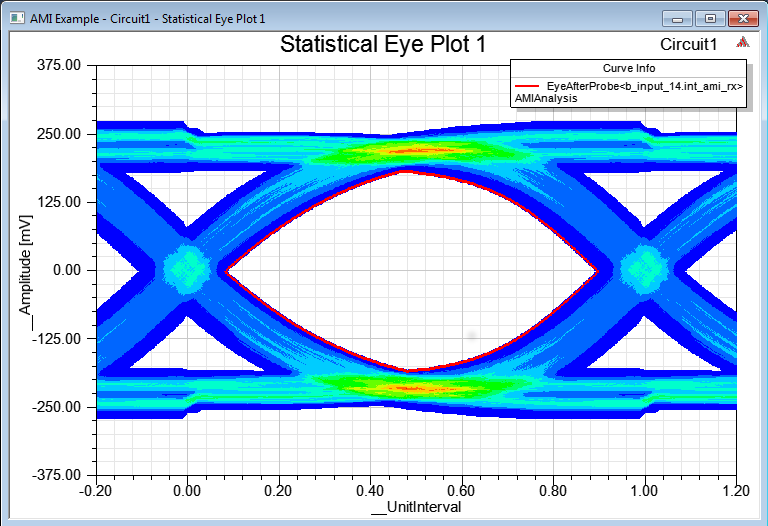
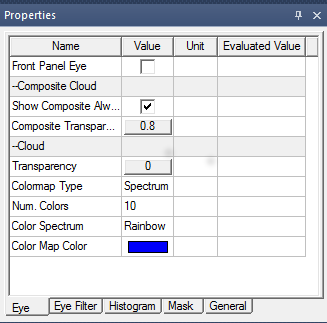
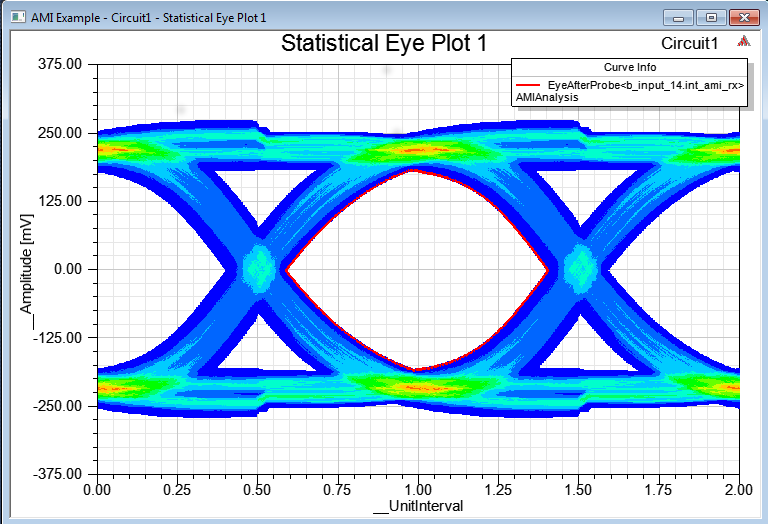
This eye diagram matches the UI extents displayed by the bathtub plot for the same trace and have a very similar eye opening position. The trace can be selected and the display changed to a "Front Panel" eye (the default option for Statistical Eye Plots is a non-"Front Panel" eye) via the "Eye" tab of the property window. This displays the [0, 2] UI extent front group box eye.