
Group Delay and Phase Deviation
The quality of linear phase needed to minimize the distortion may be measured by Group Delay or Phase Deviation.
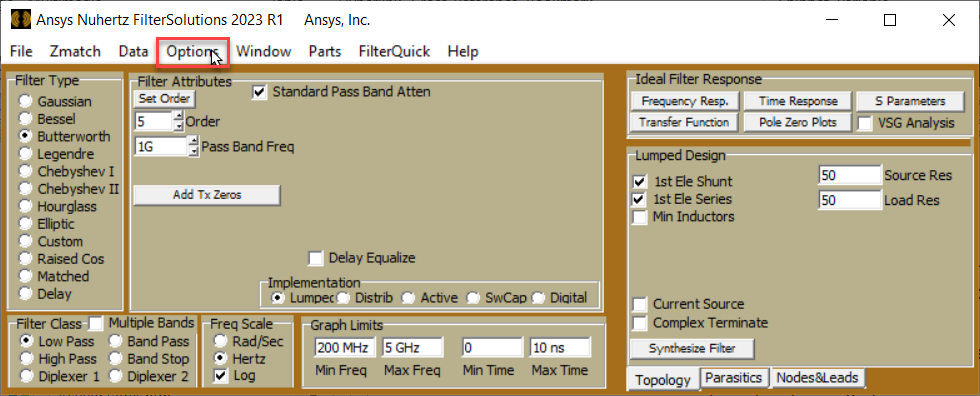
To select between the two options, for the frequency response graphic:
-
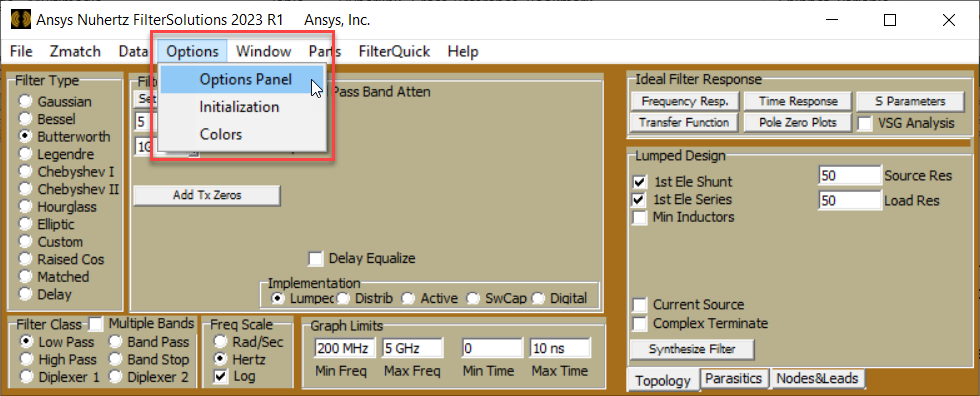
On the ribbon, select Options.
-
Select Options Panel
-
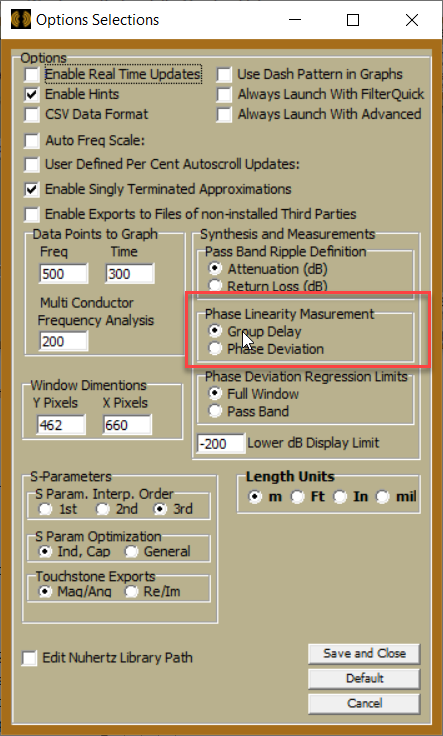
Select between Group Delay and Phase Deviation in the Phase Linearity Measurement group box.
Group Delay
Group delay is simply the negative of the derivative of the phase angle in radian with respect to frequency in radians per second, and is a very simple and straightforward method to measure linear phase, with a purely horizontally flat group delay being ideal. Tuning and optimizing functions may be used to force a linear phase by forcing the group delay to be flat. The value of the group delay may vary greatly, so optimizers must be set to a reasonable value and force the desired frequency range to that value or within a range of values.
Phase Deviation
Phase deviation, or deviation from linear phase, is the difference between the linear regression of the unwrapped phase angle and the actual value of the unwrapped phase angle, providing a direct means to view the quality of the linear phase. The ideal value for linear phase is absolute zero across the desired frequency range. This has an advantage over group delay in that tuners and optimizers have a fixed target of zero to force the phase deviation, instead of an unknown or estimated flat value. The disadvantage is the linear regression must be limited to the frequency range where phase is desired to be linear, usually the passband, which somewhat complicates analysis and optimization.
Phase Deviation Regression
In the Options Selection menu (Step 3), the Phase deviation option limits are selectable, full graphical window being the default. If it is desired to limit the frequency range to the frequencies desired to be linear, this default selection works. If a broader range of frequencies is desired to be viewed, then it may be necessary to limit the linear regression to just the passband. When setting limits to just the passband it is usually desirable to also set the phase deviation measurement limits using the "Limits" selection in the frequency response graphical window to zero in on the phase deviation for the desired frequencies and exclude phase deviation elsewhere.
The frequency response of a 9 pole Linear Phase filter with 1% group delay ripple is shown below in Figures 1A, 1B, 1C, and 1D with the various described methods of viewing the quality of linear phase.
Figures 1A and 1B: Group Delay and Phase Deviation, Full Window
Figures 1C and 1D: Phase Deviation, Pass Band Regression, Default and Phase Deviation, Pass Band Regression With Adjusted Vertical Limits
Figures 1A - 1D: Various Forms of Linear Phase Measurements
Custom Regression Limits
If it is desired to limit the phase regression to something other than the pass band or graphical window, Advanced Panel frequency response windows permit the selection of customized regression limits by selecting the "Set Limits" button the upper right, as shown in Figure 2.
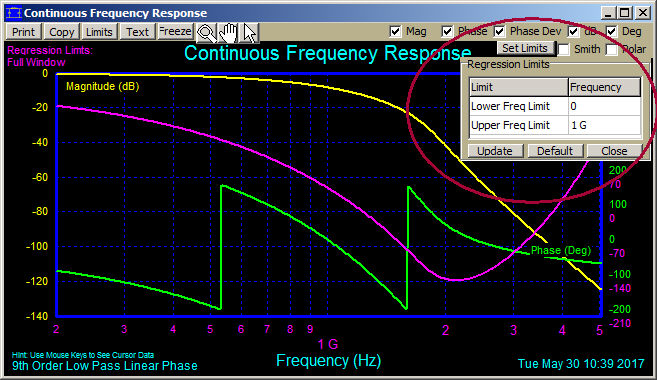
Figure 2: Setting Custom Regression Limits for Phase Deviation Measurements.