
Viewing a Monte Carlo Analysis in a Report
After running a Monte Carlo Analysis, you can plot any calculated or derived quantity against the sequence of Monte Carlo parameter values.
- Right-click the Results icon in the Project tree, and select Create Standard Report >Rectangular Plot from the menus.
- The Reports dialog opens. The Solution, Domain, and Plotting Values fields have all been filled in with the correct data.
- Click on the Families tab. Select
the Monte Carlo item to display the sweep values:
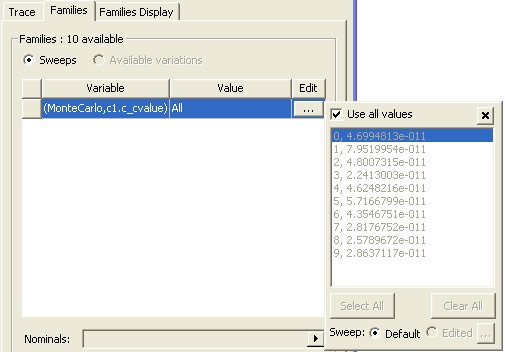
- Select the Use all values box.
- Click New Report. The report is displayed in the window.