
Report Window
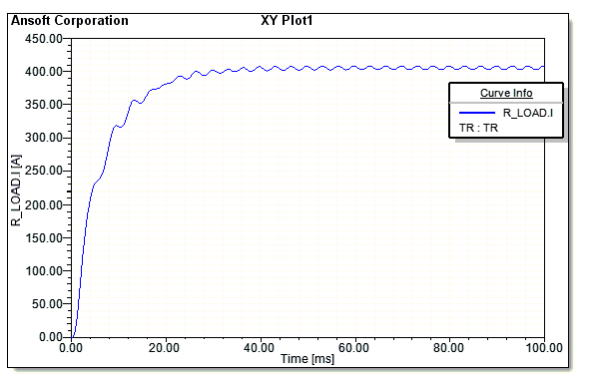
When a design has been successfully simulated, you can generate a report of the results in a wide variety of forms, including XY graphs, polar graphs, 3D graphs, Smith charts, and data tables. Various attributes of each can be customized to your liking. Here is an example of a 2D report:
For more information, see Generating Reports and Postprocessing.