
Results (Modal)
Modal analysis results presentations fall into three basic categories: Modal Reports, Fields Reports, and Field Overlays:
- Modal Report:
- Frequency: The natural vibration frequency in Hertz (cycles/second) for each mode.
- Participation Factor: A scalar variable that indicates how strongly motion in the specified rotational or translational direction is represented in the eigenvector of the mode. These values are intended to measure the relative contribution of system modes to system states, and of system states to system modes, for linear systems.
- Effective Mass: The mass that is participating in the vibration mode in the specified direction. The higher this resultant value, the more significant the particular vibration mode (that is, the more likely that external excitation will produce the resonant vibration mode).
- Effective Mass Ratio: The Effective Mass result for the given mode and direction divided by the total mass of the design. The equation for this result is as follows:
- Cumulative Effective Mass Fraction: The cumulative sum of the Effective Mass values divided by the sum of the effective mass that has participated for the specified number of calculated modes. This results will always be equal to 1.0 at the last calculated mode, regardless of the number of modes calculated. (That is, it is a normalized result.) As such, it is only useful for showing the relative significance of modes within a limited frequency bandwidth.
- Design Volume: The volume of each object comprising the design. Though you can plot volume points on a Cartesian grid, they are really only suitable for tabulation.
- Fields Report:
- Mag_Displacement: The magnitude of the displacement for the specified vibration mode. This quantity is listed under the category Calculator Expressions but will not appear until a polyline is selected from the Geometry drop-down menu of the Report dialog box.
- Design Volume: The volumes of the solid objects comprising the model. Though you can plot volume points on a Cartesian grid, they are really only suitable for tabulation.
- Named Expression: A custom result previously defined using the Fields Calculator (see the Fields Calculator Note on the Creating a Fields Report page).
- Field Overlay:
- Mag_Displacement: A color contour plot of the displacement magnitude overlaid on a deformed representation of the model. This result indicates the vibration mode shape for the specified model. (See preceding note Regarding Modal Displacement Results.)
- Displacement_Vector: This overlay has the same reported values as the Displacement Magnitude result, but it is presented as a vector plot. Arrows of different colors and lengths demonstrate the relative displacement magnitudes and directions.
- Named Expression: A custom result previously defined using the Fields Calculator (see the Fields Calculator Note on the Creating a Fields Report page).
There are several different display types available for fields reports, including 2D (Rectangular) Plots, 3D Plots, Data Tables, and more. The results that follow can be plotted or tabulated. However, by their nature, modal results are typically more suitable for tabulation than plotting. When presenting graphically, a discrete or bar-graph type of plot is best, since continuous curves interpolate values between calculated points. For modal analyses, resonant frequencies do not exist between vibration modes. Therefore the interpolated values are invalid.

where Mei is the effective mass participating in a particular direction for mode number i, and M is the total mass of the structure.
The sum of this result for all calculated modes represents the true cumulative effective mass participation that has been achieved by the number of modes calculated. You can report the sum of this result by using the sum Range Function.
The Data Table Example outlined in the Creating a Modal Report subtopic shows how to sum the Effective Mass Ratio modal results. Specifically, refer to steps 4 and 5 of that procedure.
The equation for the sum of the Effective Mass Ratio results in a given direction is as follows:
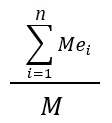
where i is the mode number, n is the total number of modes calculated, and the other variables are as previously defined.
|
CAUTION: This result does not represent the true cumulative effective mass participation, since only the participating mass through the last calculated mode is considered (not the full mass of the design). For a more meaningful evaluation of total effective mass participation, sum the Effective Mass Ratio values for the calculated modes and directions. (See the note under Effective Mass Ratio above.) Ensure that these sums satisfy any applicable design code or standard. For example, common guidelines state that 85% or 90% (0.85 or 0.9) cumulative effective mass participation must be achieved. If the applicable standard has not been satisfied, increase the number of modes specified in the setup and rerun the solution to capture additional mass participation. |
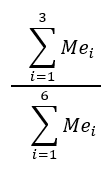
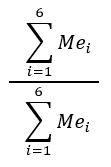
Example: The following table shows the equations used for the Cumulative Effective Mass Fraction based on a total of 6 calculated modes. The third and sixth mode are tabulated:
| Mode Number |
Cumulative Effective Mass Fraction Equation |
Result |
|---|---|---|
| 3 |
|
< 1 |
| 6 |
|
1.0 |
where i is the mode number and Mei is the effective mass for mode number i.
The following example illustrates the difference between a cumulative sum of the Effective Mass Ratios and the Cumulative Effective Mass Fraction for a six-mode analysis and a total mass of 10 kg:
| Mode Number | Effective MassX (kg) | Effective Mass RatioX | Cumulative Eff. Mass FractionX |
|---|---|---|---|
| 1 | 6.00 | 0.600 | 0.7186 |
| 2 | 0.50 | 0.050 | 0.7784 |
| 3 | 1.50 | 0.150 | 0.9581 |
| 4 | 0.00 | 0.000 | 0.9581 |
| 5 | 0.25 | 0.025 | 0.9880 |
| 6 | 0.10 | 0.010 | 1.0000 |
| Totals: | 8.35 | 0.835 |
There are several different display types available for fields reports, including 2D (Rectangular) Plots, 3D Plots, Data Tables, and more. One convenient way to generate a fields report for modal solutions is to draw a polyline running along the faces and/or through the interior volume of your model. This polyline, which can consist of multiple straight and curved segments, defines a path along which you wish to plot a particular modal result.
You can also plot user-defined Named Expressions along a polyline, or create named expressions that do not need a polyline for plotting.
Regardless of the display type, the following modal field results are available for reporting.
In a modal analysis, the magnitude of the displacement is arbitrary. Displacement results are not scaled to any specific excitation force, acceleration, or power spectral density. Therefore, the absolute displacement values are meaningless. Only the relative values are meaningful in that they demonstrate the shape of the deformed structure for each vibration mode. Do not be concerned if the displacement magnitudes are out of proportion with the size of the model.
You can overlay fields on selected solid or sheet objects, faces, or polylines. The following three results are available:
These reports and overlays are described in the subsections that follow along with the instructions for creating them.