
Viewing Convergence Data
To view an adaptive solution's convergence information, either during or after the solution process:
- In the project tree, right-click the solution setup of interest, and then click Convergence on the shortcut menu.
- If you have run multiple simulations, from the Simulation list, select the solution setup for which you want to view convergence data.
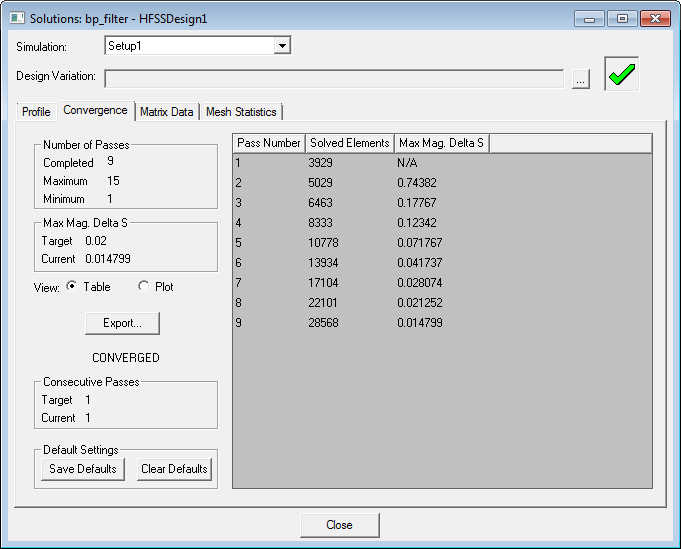
- Under the Convergence tab, depending on your design setup, you can review the following convergence data:
- Whether the solution is converged or not converged.
- Number of adaptive passes completed and remaining.
- The number of tetrahedra or triangles created at each adaptive pass.
- Solution type dependent parameters such as Loss, Total Loss, Loss Error.
- Select Table
to display the convergence data in table format or Plot
to plot
the convergence data on a rectangular (X - Y) plot.
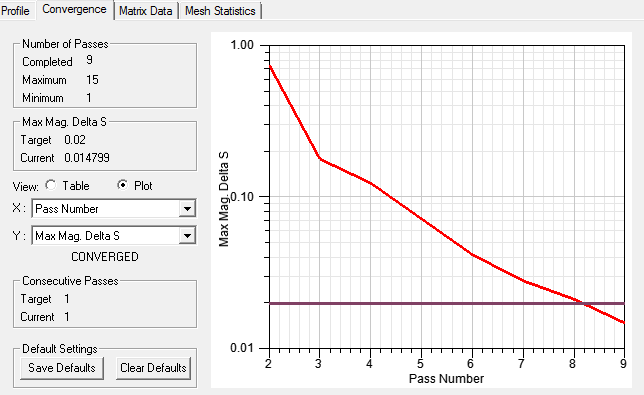
- If you select Save Defaults, the settings for Table vs. Plot, and for Plot, the X and Y axis selections, those settings apply, based on the design-type, each time you open the desktop. You can also select Clear Defaults to reset to the original settings.
The Solution Data window appears. The Convergence tab is selected. You can also select the Results tab of the ribbon, click the Solution Data icon, and click the Convergence tab when the Solution Data window appears.
By default, the most recently solved solution is selected.
Note:
In the case of the 3D AC Conduction solver, even though the convergence columns names refer to the loss as a solution criteria, the convergence parameter considered is the magnitude of the apparent power.