Field Plots on Layout Components Layer or Net
If a
To Plot Fields for a Design Including Layout Components
First, analyze the design. During simulation setup, ensure the Save Fields option is selected. Designs analyzed before release 2023R2 must be analyzed again to extract the necessary information for plotting.
Whereas for designs without layout components, you must select a geometry for the plot before you select the Plot Fields command, for designs with layout component, you make selection both before and after selecting Plots Fields to open the Create Field Plot dialog box.
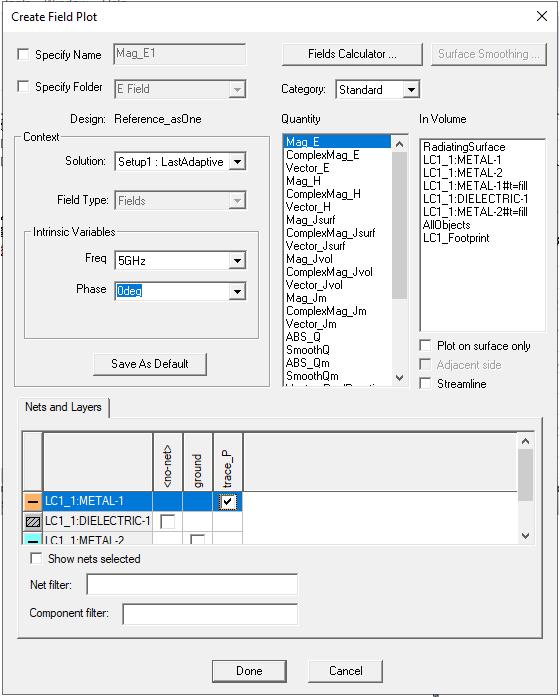
For designs that include Layout Components, the Create Field Plot dialog box includes a Nets and Layers panel that provides additional functionality, showing the layers and nets of every layout component in the design. The In Volume field also allows selection of geometries from the layout components.
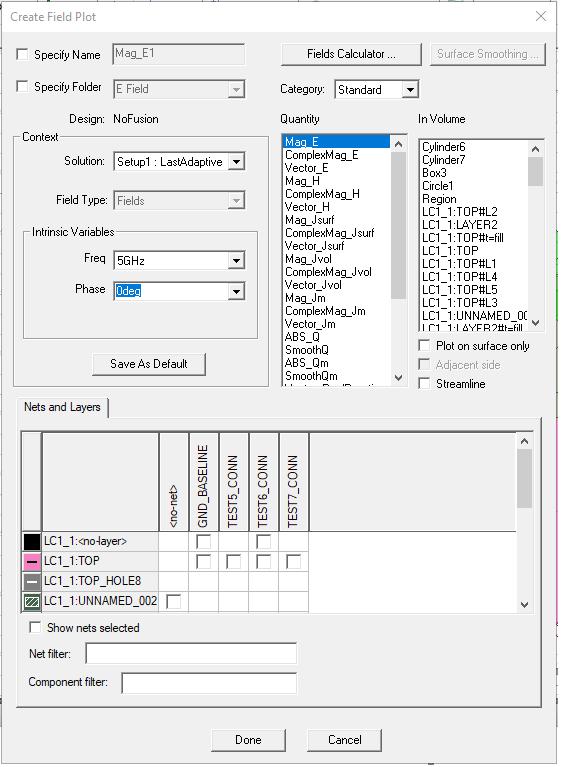
This Nets and Layers section displays all the layers and nets of every layout component in the design. Upon opening, it adjusts its size to try to show all the rows and columns for the layout components. You can resize the parent dialog box. For objects in the component belonging to a specific layer and net, you can select a checkbox. By clicking the column headers, you can select or unselect check boxes for an entire column. You can toggle the “Show nets selected” checkbox to move all the selected nets to the left side of the table. You can use the Net filter and Component filter fields to filter out specific nets and components. The net and component filters support ‘*’ and ‘?’ wildcards and you can delimit multiple filters with commas. The Nets and Layers table is refreshed each time you update the filter text.
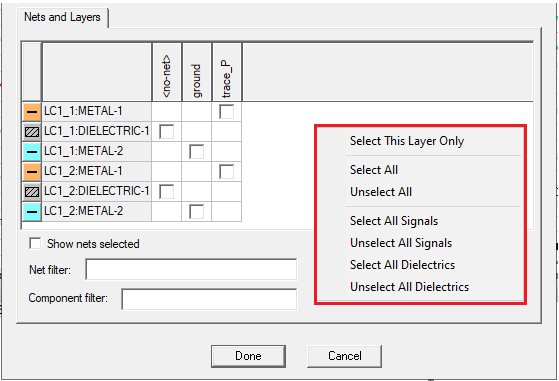
If you right click on the Nets and Layers panel, a shortcut menu appears that lets you Select This Layer Only, Select or Unselect All, Select or Unselect All Signals, or Select and Unselect All Dielectrics.
You select Context, Quantity and In Volume information as usual for Plotting Field Overlays.
Once you click Done to apply and close the dialog box,
If there are layout components in the design, and you want to reassign an existing field plot or mesh plot, a new dialog box will pop up as shown below.
This dialog box allows you to reassign the existing plot on layout components’ nets and layers. As with the Nets and Layers sub dialog for the Create Field Plot dialog box, this dialog box shows layers and nets of every layout component in the design, with identical behavior and usage, including the short-cut menu that lets you Select This Layer Only, Select or Unselect All, Select or Unselect All Signals, or Select and Unselect All Dielectrics.
Once you click OK,
If there are no layout components, this dialog box is not shown, and the workflow for reassigning field/mesh plot is unchanged.
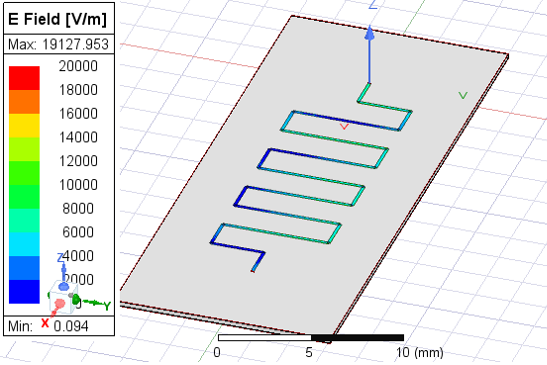
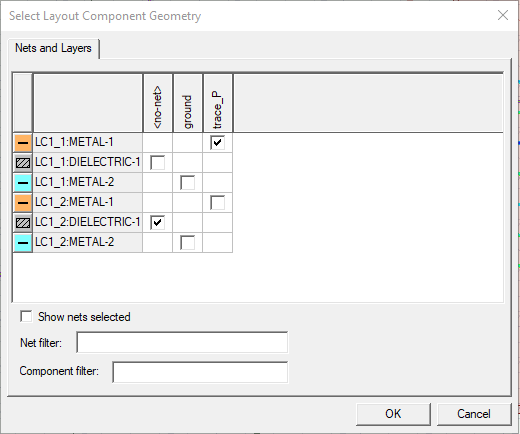
Example with Metal Trace from Layout Component
For example, you could select a metal trace from a layout component in the Nets and Layers table as shown below.
The Model window will show the field plot as follows.