
Performance Computation Based on FEA Created ROM for Induction Machines
Using the Maxwell 2D and 3D eddy current solvers, you can create an FEA (finite element analysis) reduced-order model (ROM) of an induction machine using the ECEIM_Model. Performance data based on this model can then be used by RMxprt Inner-Rotor, Outer-Rotor, or Axial-Flux induction machine designs to generate various efficiency maps.
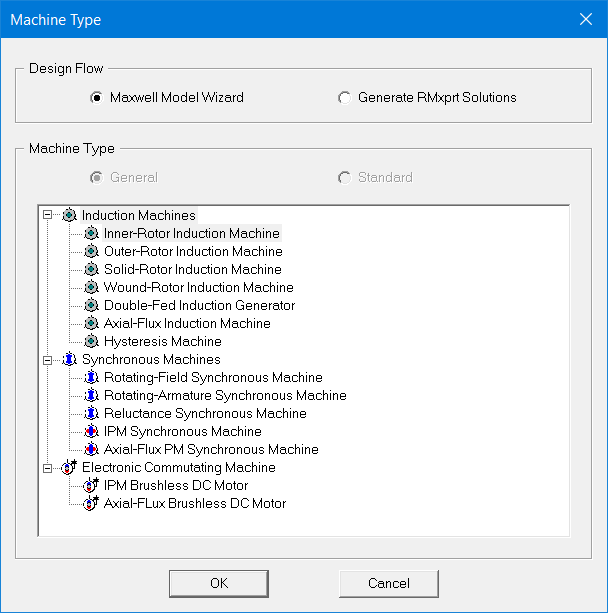
The following induction machine designs in the Machine Type panel are supported:
- Inner-Rotor
- Outer-Rotor
- Axial-Flux
A file named ece_table.txt is created by the Maxwell 2D and 3D eddy current solvers to record the parameters and look-up tables of the reduced order model (ROM). You can find this file in the <projectname>.aedtresults\<designname>_ECE.results\<designsolution>.ECE folder. For example:
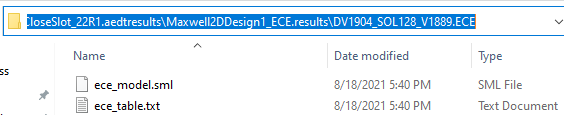
This file can be imported to an RMxprt design for the purpose of performance analysis.
The full path of ROM file ece_table.txt is specified in the RMxprt DesignSettings dialog box User Defined Data tab using the “ReadPathROM” keyword, as shown below. The RMxprt solver reads model parameters from the file, and calculates and outputs machine performance data and curves at no-load, rated load, break-down, and starting operations based on the design specifications and the ROM parameters read from the file. The RMxprt solver will then output performance maps which can be displayed as Line, Fringe, or Tone contour types.
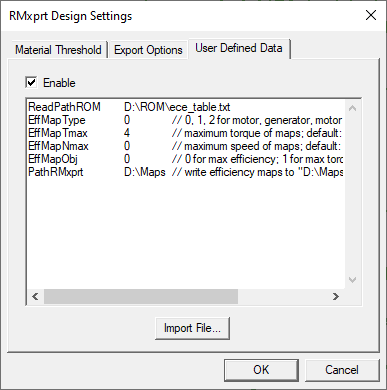
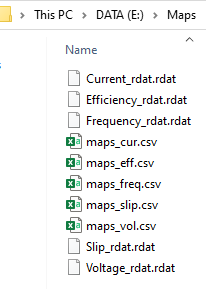
Because the FEA-created ROM does not include the effects of core loss and mechanical loss, the core loss in RMxprt performance computation is based on a constant core-loss resistance called Rfe, which is derived from the core loss at rated operation in RMxprt. To get a more accurate Rfe, use a RMxprt design that has the same geometry and operating conditions as the Maxwell design used to create the ROM. The mechanical loss at various rotor speeds is derived from the frictional and windage losses at reference speed specified in Machine/Shaft properties. Keyword PathRMxprt in User Defined Data as shown above is used to define the path where all performance-map files, with extension name .rdat, will be copied.
To display a performance map, you can open the relevant .rdat file by right-clicking on the RMxprt design Results in the Project Tree and selecting Create Report From File. The default contour type is Line. You can change it to Fringe or Tone by double-clicking on the Color Key and change IsoValType to Fringe or Tone in the Contour tab.
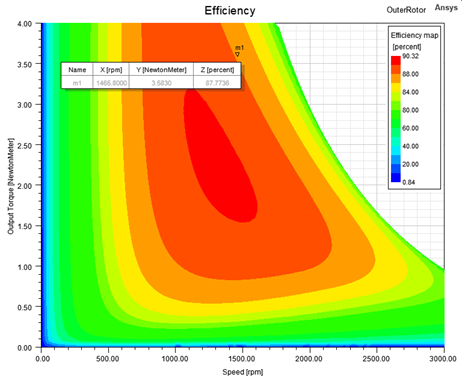
The performance maps are displayed in motor mode by default, as shown below, where the torque axis is labeled as Output Torque.
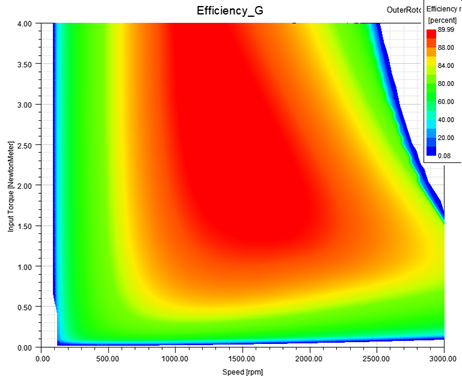
The maps can also be displayed in generator mode, as shown below, where the torque axis is labeled as Input Torque.
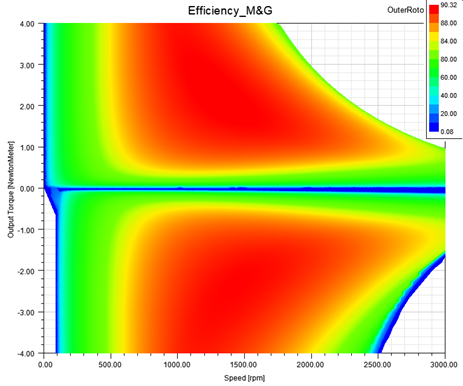
You can also display the motor and generator modes together, as shown below, where the torque axis is labeled as Output Torque and the generator mode is displayed at the fourth quadrant with negative torque values.
In User Defined Data, the keyword to define the map type is EffMapType” with values 0, 1, and 2 for motor mode, generator mode, and motor&generator modes together, respectively.
In motor mode maps, the output power is the shaft mechanical power. On the speed and torque axes, the output power is zero, and the efficiency is zero. In generator-mode maps, the input power is in the shaft side. If the input mechanical power is not large enough to overcome the mechanical loss, the machine will absorb electrical power to balance machine loses. In a narrow band area along the speed and torque axes, the machine will absorb both electrical and mechanical powers to balance all machine losses, and the machine operates at the breaking mode. In the breaking-mode area, efficiency is not well defined. Therefore, generator mode maps will not include the breaking-mode area.
For the combined motor mode & generator mode map, notice that the efficiency in the breaking-mode band area along the speed axis is not defined, and the map in this area is filled with the data interpolated from the motor-mode and generator-mode data.
In a performance map, a given mechanical point with a pair of specified speed and torque values may correspond to different operating conditions. For example, for a given frequency, we can adjust the terminal voltage of the machine at the specified speed to reach to the specified torque. When we change the frequency, we can get different performances at the specified speed and torque values, and we just record the best one for the map. The default best performance is with highest efficiency. We can also define the best performance as the largest value of torque to current ratio. We can specify this optimization object via keyword EffMapObj: 0 for maximum efficiency, and 1 for maximum torque to current ratio.
The limit values for speed (N) and torque (T) range can also be specified by keywords EffMapNmax and EffMapTmax, respectively in User Defined Data. The default speed limit value is two times the synchronous speed; and the default torque limit value is the rated torque. If the specified values are smaller than the default values, the default values will be used.
To display the Z value of a map, you can add a Marker at an arbitrary point, such as m1 in the first map above. In the listed data sheet, you can double-click on a row, such as m1, to modify the values of X (for speed) and Y (for torque). In this way, you can view the performance values of all maps at the same (speed, torque) Marker point. From the voltage and frequency maps, you can get the voltage and frequency values, based on which you can setup a Maxwell transient design to validate the values of all performance maps.