Cut Plane
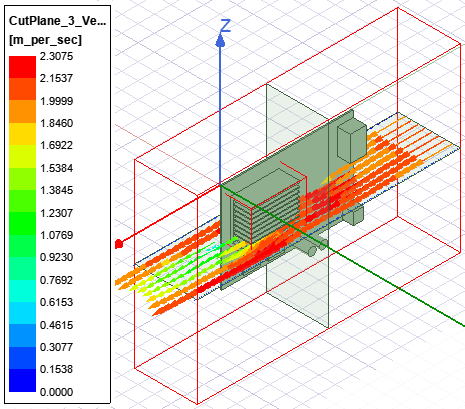
Cut Plane allows you to create a plot thermal or flow data on contours or vectors on a plane. Cut planes allow you to examine areas between objects in the model (in which the fluid alone exists), as well as regions inside objects that contain a fluid or solid material.
Note: The Cut Plane toolkit creates plots that display data in decimal notation.
|
Name |
The Name appears in the Project Manager window, history tree, and 3D Modeler window. |
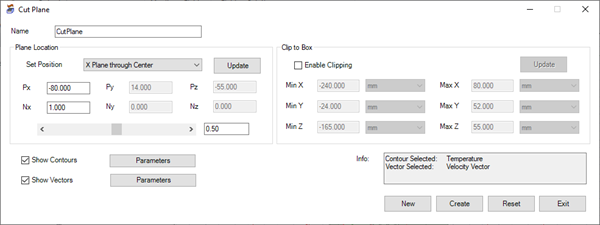
| Plane Location | Under Plane Location, specify the location of the plane using one of two methods. Select X plane through Center, Y plane through Center, or Z plane through Center in the Set position drop-down list under Plane location. The cut plane created is perpendicular to the specified axis. For example, selecting Y plane through Center creates a plane in the x-z plane located in the center of the model. You can also specify the location by selecting Point and Normal. Then, enter the coordinates of a point on the plane (Px, Py, Pz). Enter a vector defining the direction normal to the plane (Nx, Ny, Nz). For example, entering (1, 0, 0) for the vector will define a normal pointing in the x direction. The positioning slider bar is only available when creating a cut plane using X, Y, and Z plane through center. |
|
Clip to Box |
If needed, under Clip to Box, select Enable Clipping to create a cut plane that spans a specified sub-range. Enter values in the Min and Max fields and click Update. |
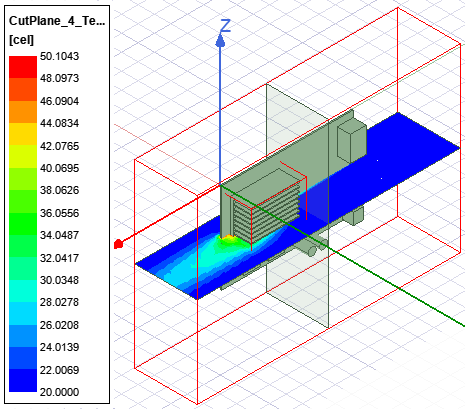
| Show Contours | Select Show Contours and click Parameters to display the Plane Cut Contours dialog box. See below for more information. |
| Show Vectors | Select Show Vectors and click Parameters to display the Plane Cut Vectors dialog box. See below for more information. |
| Info | The Info dialog displays which quantities are plotted on the contours and/or vectors. |
| New, Create, Reset, Exit | Click New button to create a cut plane (if not already created) based on selected options and then show the preview of new cut plane with all values reset to default values. Use the New button control to adding multiple contours without closing the toolkit. Click Create to create the cut plane based on the current selections. Click Reset to restore default values. Click Exit to close the Cut Plane dialog box. |
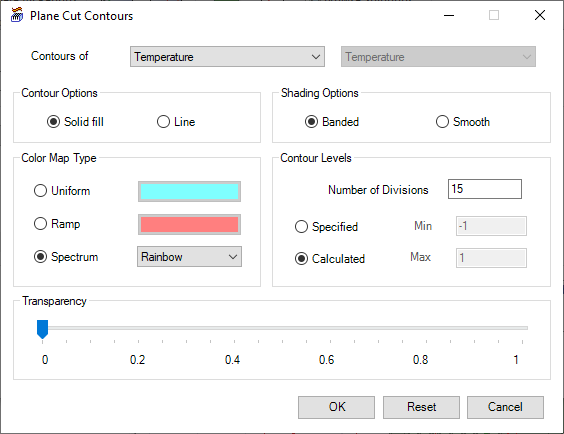
| Contours of | In the Contours of drop-down list, select the quantity of data to plot on the cut plane and its components (if any). |
| Contour Options | Under Contour Options, specify Solid fill if you want a solid contour plot or Line if you want a line contour plot. For solid fill contour plots, specify the Shading Options. |
| Shading Options | Under Shading Options, select Banded to have the colors change abruptly at the contour boundaries. Select Smooth to vary the colors smoothly in continuous gradations from one boundary of the contour to the other. |
| Color Map Type | Under Color Map Type, select Uniform to display one color on the cut plane. Select Ramp to display a gradient of the selected color. Select Spectrum and a color option to display a range of colors. |
| Contour Levels | Under Contour Levels, enter a value for Number of Divisions to specify the density of the lines. Select Specified to specify the minimum and maximum values in the displayed value range, or select Calculated for Icepak to automatically select the values based on the calculated minimum and maximum. |
| Transparency | Under Transparency, use the slider bar to adjust the transparent or opaque the cut plane contours appear. |
| OK, Reset, Cancel | Click OK to save the settings and close the Cut Plane Contours dialog box. Click Reset to restore default values. Click Cancel to close with dialog box without saving. |
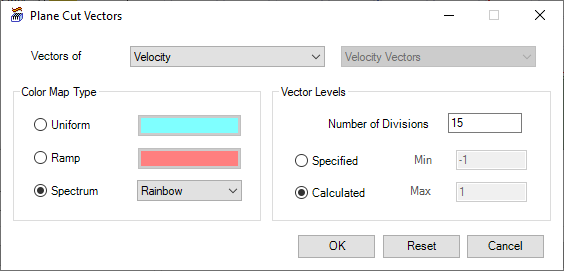
| Vectors of | In the Vectors of drop-down list, select the quantity of data to plot on the cut plane and its components (if any). |
| Color Map Type | Under Color Map Type, select Uniform to display one color on the cut plane. Select Ramp to display a gradient of the selected color. Select Spectrum and a color option to display a range of colors. |
| Vector Levels | Under Vector Levels, enter a value for Number of Divisions to specify the density of the lines. Select Specified to specify the minimum and maximum values in the displayed value range, or select Calculated for Icepak to automatically select the values based on the calculated minimum and maximum. |
| OK, Reset, Cancel | Click OK to save the settings and close the Cut Plane Vectors dialog box. Click Reset to restore default values. Click Cancel to close with dialog box without saving. |