
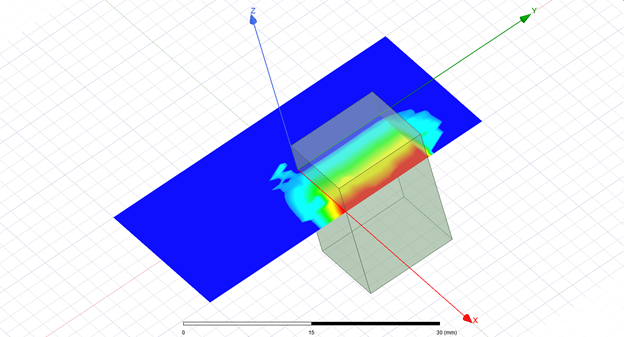
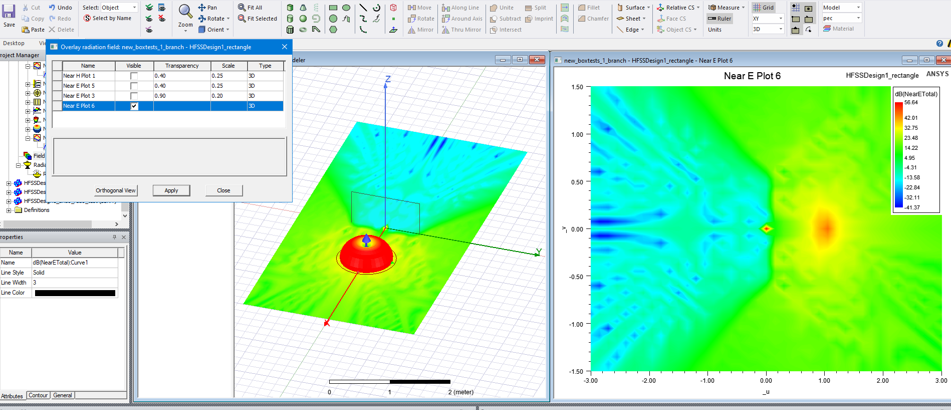
Overlay of Contour Plot of Near Field on Rectangle
For some contour plots like that for Near Field on a Rectangle radiation setup defined in a local coordinate system with physical dimensions, it makes sense to show the overlay of 2D contour plot in its actual defined rectangle in 3D space.
This feature is to allow user to have 3D overlay and its animation for this type of contour plot. The complete criteria of eligibility for overlay of this type of contour plot is as follows:
- Only a single trace plot
- Primary/Secondary sweep is _u and _v or _v and _u
- X/Y component of the trace is _u and _v or _v and _u
- No range function is used for Z component
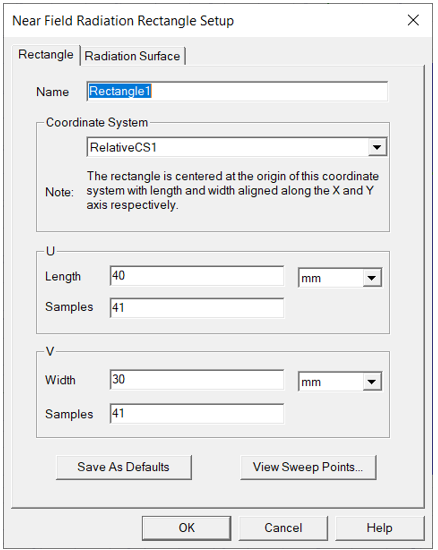
The Near Field rectangle setup looks something like this.
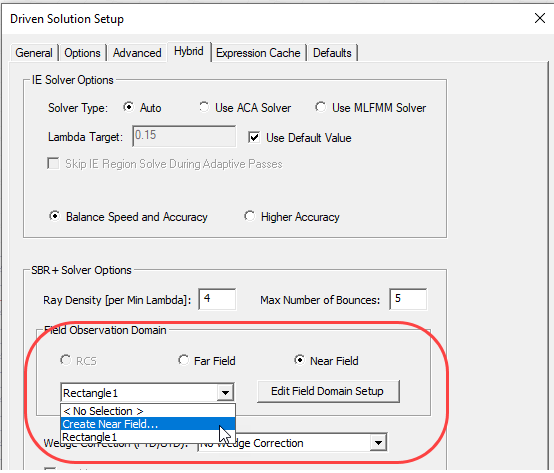
For HFSS Modal or Terminal solution types using SBR+ Regions, or HFSS SBR+ solution types, you must create the Near Field Rectangle before simulation. You can do this through the Field Observation Domain setting on the Hybrid tab of the Advanced Driven Solution Setup for and HFSS Driven Modal or Terminal Solution, or the Options Tab of the Driven Solution setup for an HFSS SBR+ Solution type setup.
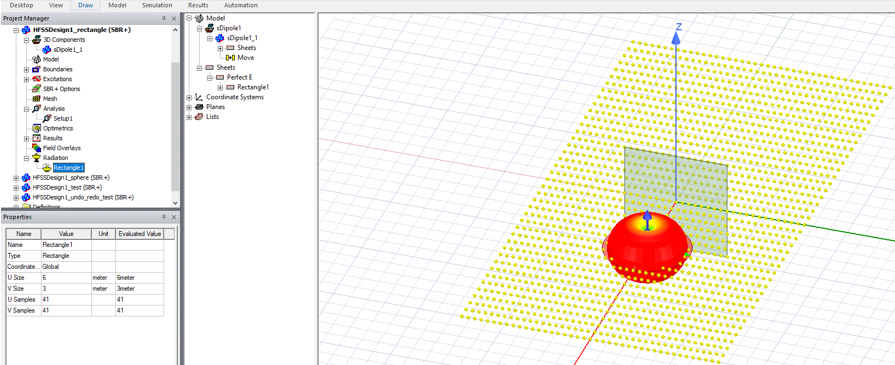
To preview the sampling points for a Near Field Rectangle, select the setup under the Radiation icon in the Project tree.
The Report dialog for a Rectangular Contour plot of near field, using a Near Field Rectangle as the geometry, a combination of _u and _v as the Primary and Secondary sweeps is as follows.
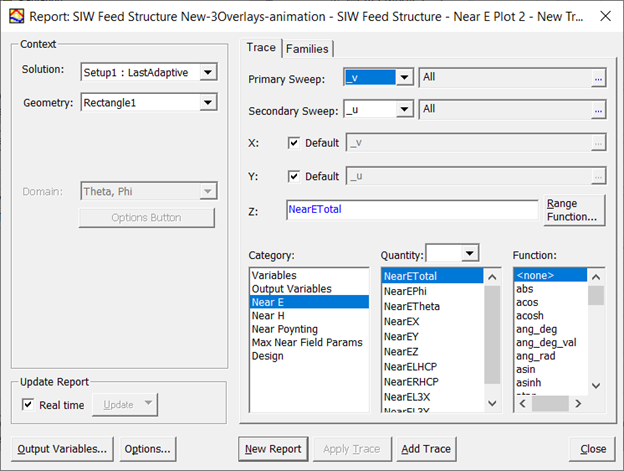
A rectangular Near Field contour plot can be viewed as a report plot, or overlaid in the model window, just like other overlays, through the context menu. Rectangle size is not reflected in its 2D plot, it is only available in its overlay. The same applies to the coordinate system.
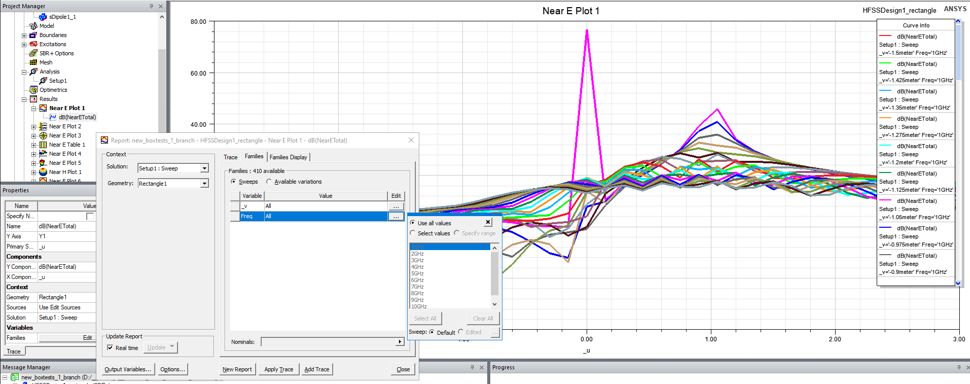
This Near Field Rectangular contour plot overlay can also be animated if there is a sweeping variable which could change the plot as the variable changes (e.g. it could change the rectangle location, etc.)
Also see Creating 2D Radiation Field Plot Overlay Animations