
The Beatty Standard and its Use
What is the Beatty Standard? as drawn from Reference [1]
- A series resonator between two lines of characteristic impedance Z0.

- Z0 length of line is 0.25 inches. ZB length of line is 1 inch.
How it performs:
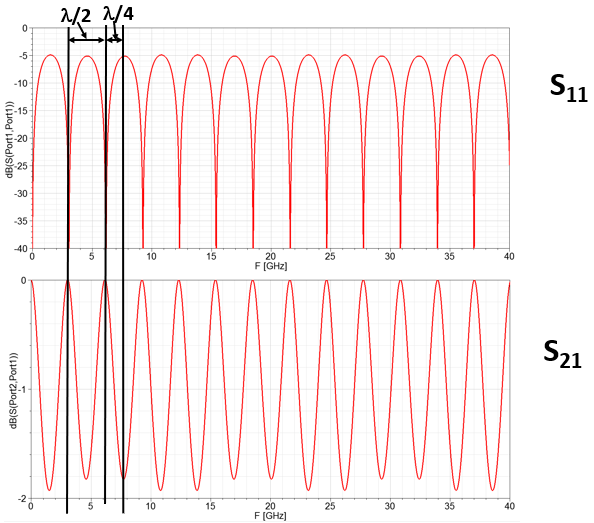
The resonator will have a periodic response because of transmission line effects
S11 maximums (and S21 minimums) will also be λ/2 apart
S11 minimum to maximum (and S21 maximum to minimum) will be λ/4 apart
How the Beatty Standard Performs: Lossless
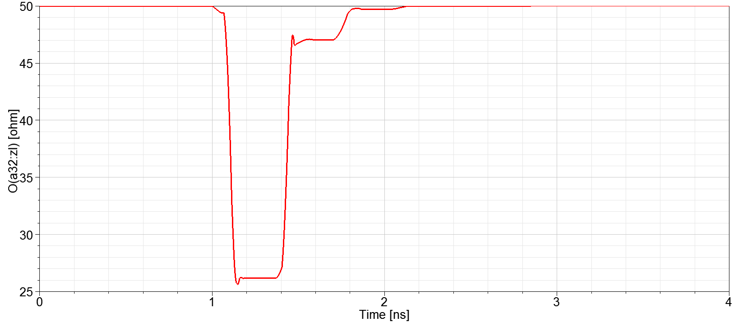
How the Beatty Standard Performs, TDR
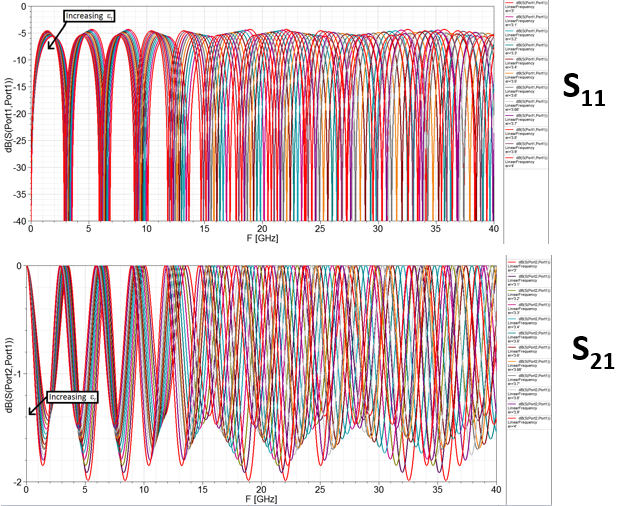
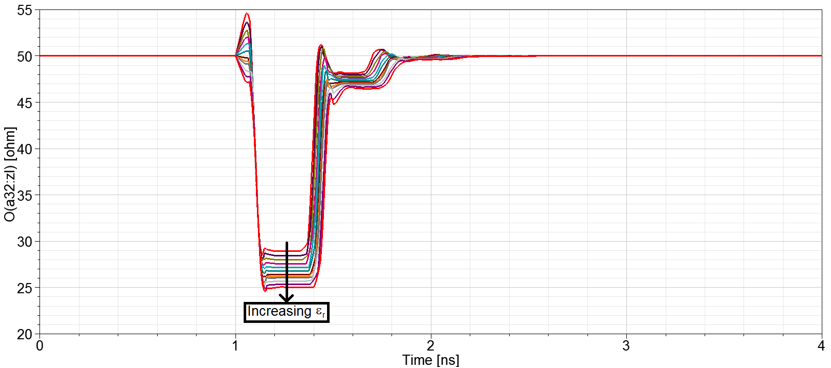
What about Changing εr?
This plot shows dielectric constant sweep from 3 to 4. Changing εr moves the distance between maxima and minima.
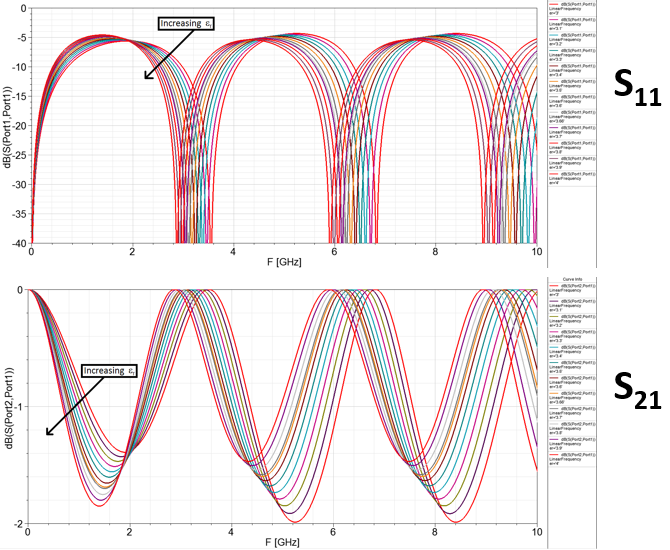
Dielectric Constant, continued: Zoom in, the better to see Changing εr
Electrical length is changing with the dielectric constant.
Dielectric Constant, continued. Now Look at TDR to see effects of Changing εr
What about Metal Conductivity?
Look at DC, or a low as you can.
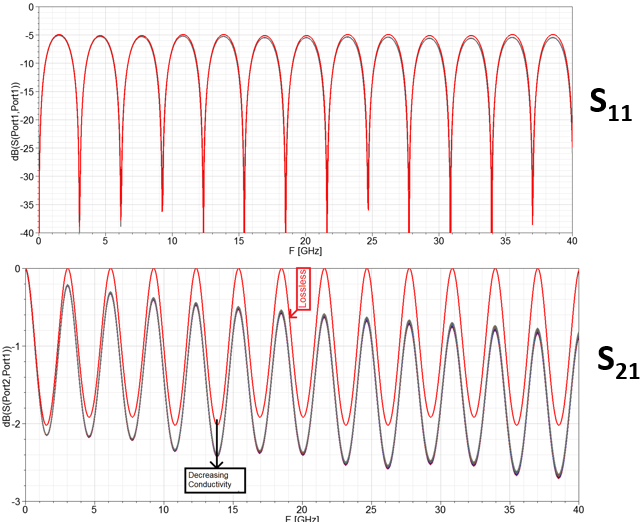
What does this tell us about metal conductivity? There is a change in plot shape due to loss.
- Look at DC to eliminate skin effect and surface roughness effects
- Network Analyzer is not be best tool to measure this low in frequency
- Will likely need to use Impedance Analyzer or precision Ohm-meter.
- Results of DC resistance of structure show below vs. metal conductivity
| Conductivity (S/m) | DC Resistance (W) |
|---|---|
| 5.0x10⁷ | 0.070643 |
| 5.1x10⁷ | 0.070241 |
| 5.2x10⁷ | 0.069855 |
| 5.3x10⁷ | 0.069483 |
| 5.4x10⁷ | 0.069125 |
| 5.5x10⁷ | 0.068780 |
| 5.6x10⁷ | 0.068448 |
| 5.7x10⁷ | 0.068127 |
| 5.8x10⁷ | 0.067817 |
| 5.9x10⁷ | 0.067518 |
| 6.0x10⁷ | 0.067228 |
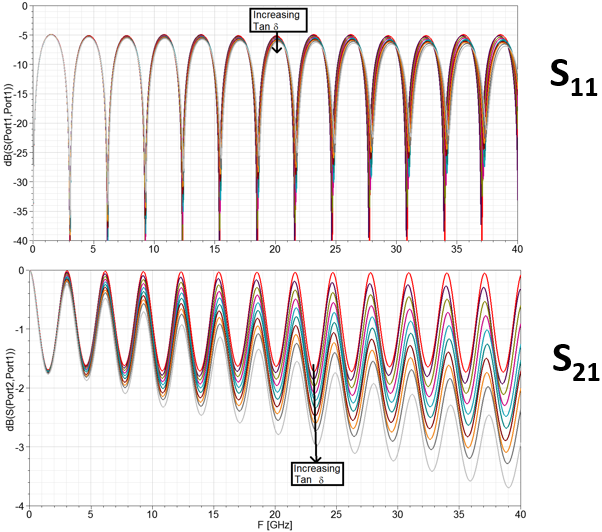
What about Loss Tangent?
The plots shows a change in shape due to substrate loss.
- We know metal conductivity from DC value, so change tan to get loss to match. Sweep from 0.001 to 0.01.
- Less change at “low frequency” and more “high-frequency” loss with tand
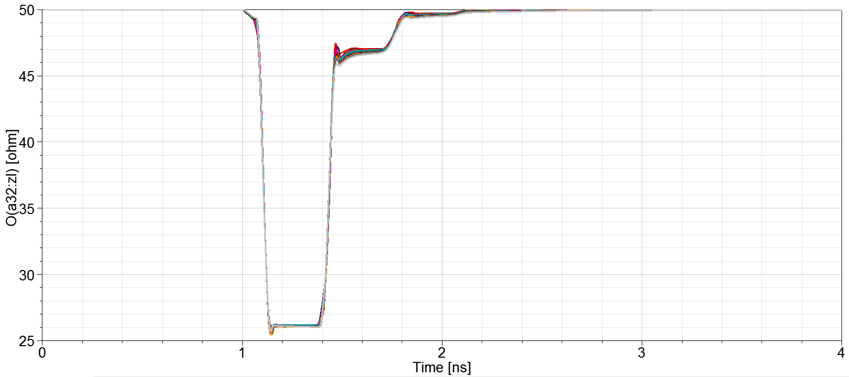
Now Look at TDR for Loss Tangent
This shows a change in shape due to substrate loss, with little change in TDR.
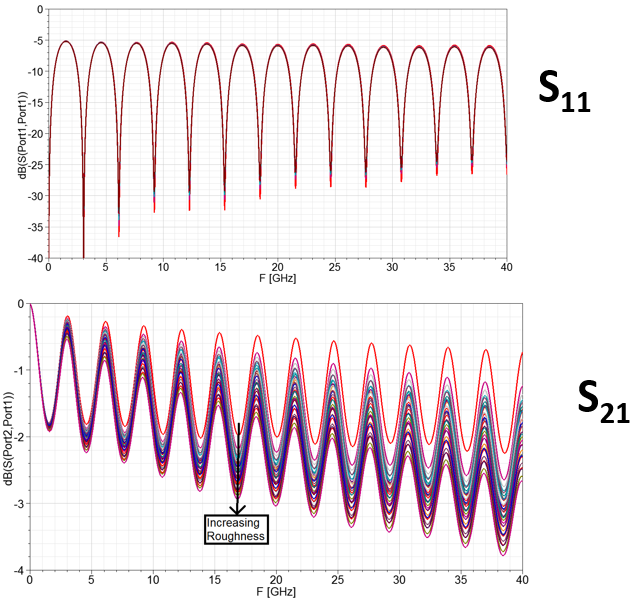
What about Surface Roughness?
This plot shows a change in shape due to roughness.
- Similar loss as loss tangent at high-frequency.
- More loss at low frequency. Match low frequency first with surface roughness.
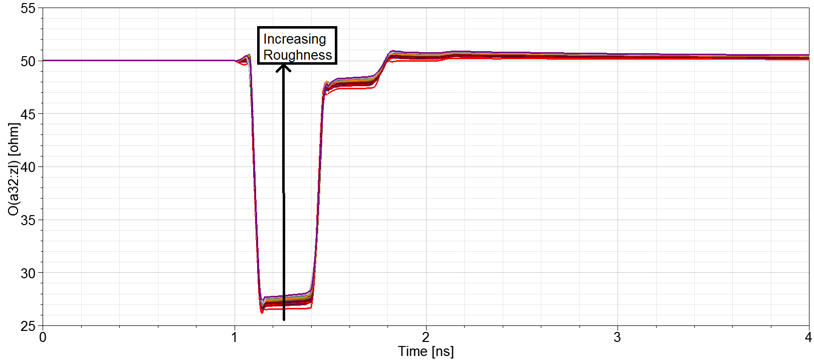
Now Look at TDR for Surface Roughness
The plot shows change in shape due to roughness.
- More change in impedance compared to changing loss tangent.
- May be important to separate roughness from substrate loss.
Observations so Far
- Change εr to match spacing between maxima and minima.
- Look at very low frequency (ideally DC) to match conductivity
- Look at “low frequency” to match Surface Roughness
- Look at “high frequency” loss to match Loss Tangent after Surface Roughness is matched.
- Look at TDR plot to help separate loss if not obvious from Frequency Domain data
Not Looking at:
- Changing line and substrate dimensions
- Restricting variables to tune for loss
- Need to verify all the thickness, widths, and any etch with cross-section
- Phase Information and Group Delay
- To verify propagation time if needed for fine tuning
What Have We Haven’t Looked At
- Changing line and substrate dimensions
- Restricting variables to tune for loss
- Need to verify all the thickness, widths, and any etch with cross-section
- Phase Information and Group Delay
- To verify propagation time
Next