Monitoring Jobs
There are a number of tools that allow you to monitor jobs, including the Monitor Job window and detailed .log files.
- Monitor Job Window
- Monitoring Ansys Cloud Direct Jobs
- Monitoring Ansys Cloud Burst Jobs
- Monitoring Large Scale DSO Jobs
- Web Client for Batch Solve Monitoring and Reporting
Monitor Job Window
The Monitor Job window allows you to monitor the progress and status of jobs, including information on variations solved so far, variations currently solving, and the number of variations remaining.
To monitor jobs:
- Access the Monitor Job window one of the following ways:
- Click Tools > Job Management > Monitor Jobs.
- Select the Simulation tab and click the Monitor icon.
- From a Command window, use the -showmonitorjobs command.
- Job to Monitor – Allows you to select either a recent job, or a project containing the job you want to monitor. You can select an archive.
- Job Status – The current job status. The normal progression is: Starting Monitoring, Queued, Running, Shutting Down, Completed. A status of Unknown may indicate a connection problem.
- Job ID – Identified by the scheduler prefix and job number.
- Simulation – Drop-down menu that allows you to select an individual simulation setup.
- Design Variation – Click the ellipses button (...) to select or deselect design variations.
- Profile Tab – Displays detailed information about completed tasks, including execution time and memory usage.

- Convergence Tab – Displays the completed, maximum, and minimum Number of Passes.
- Messages – Displays errors, warnings, and job information. Use the check boxes to choose which of these to display.

- Progress – Displays progress bars when tasks are currently in progress.

The arrow button opens a menu that allows you to either Abort that analysis, or perform a Clean Stop.
- Refresh Job Output – Allows you to select either manual or automatic refresh for the Monitor Job window.
- Click Close when you are done monitoring.
The Monitor Job window appears.
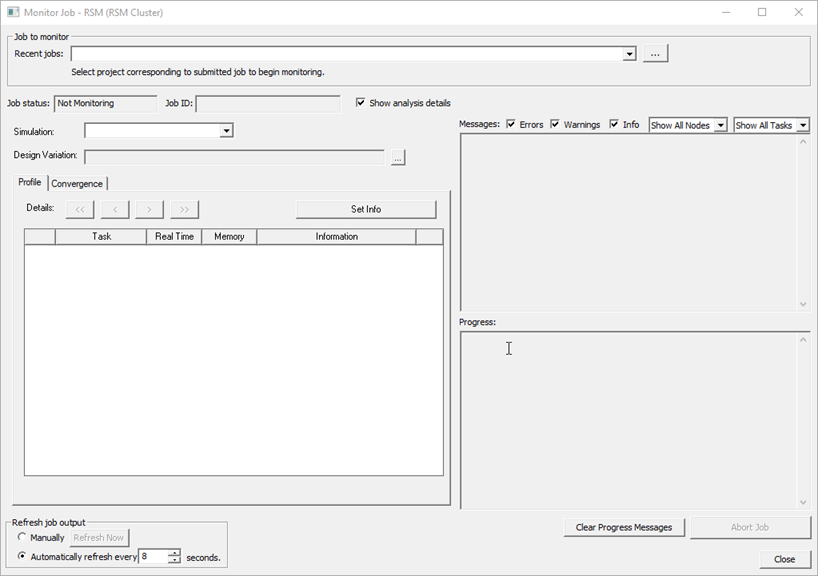
The window may look slightly different, depending on your selected scheduler and design type.
The Monitor Job window contains the following areas:
To display less information, deselect Show analysis details. This removes the Simulation, Design Variation, Profile, and Convergence information, instead displaying only Messages and Progress.
Monitoring Ansys Cloud Direct Jobs
For Ansys Cloud Direct submissions, the Monitor Job window includes two additional items:
- Portal – link to the Ansys Cloud Direct Portal, where job details and additional monitoring information are available.

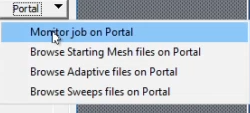
Monitor job on Portal Opens a Portal Web interface that lets you monitor an Ansys Cloud Direct job. The additional menu options for Portal are for multi-step submissions, opening the Portal Web interface directly to folders with Starting Mesh Files, Adaptive Files, or Sweeps files.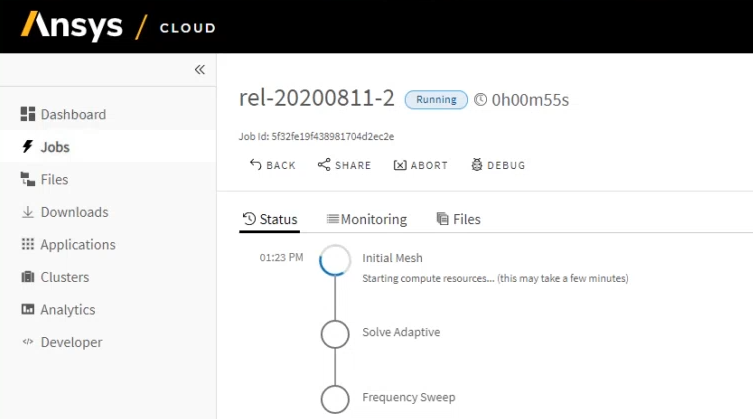
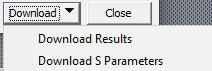
- Download – button that allows you to download the results, s-parameters, or specified files. These are saved in a folder with same name as the job ID inside the
/<project-name>.aedtdownloadfolder (or/<project-name>.aedtzdownloadfolder, if the submission was based on an archive). You can also select the Auto Download Results check box to have the results downloaded to this location automatically.
If you choose to Download Files, the Download Cloud Files dialog box appears:

Specify the types of files you want to download (separated by semicolons) and click OK.
Monitoring Ansys Cloud Burst Jobs
When you submit a job to Ansys Cloud, the job status is shown in the Monitor Jobs window. The Job ID shown here is a short numeric identifier used to distinguish multiple jobs for the same project. Use the drop-down list at the upper right to select a different job for the same project. The Monitor Job window includes two additional items, Portal, and Download.

The Portal drop-down button provides a link to the Ansys Portal, where job details and additional monitoring information are available. For more information, see the Ansys Portal Guide.
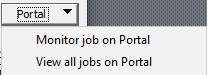
Monitor job on Portal opens a job details view for the current job in Ansys Portal. View all jobs on Portal opens a job list view in Ansys Portal, enabling you to select a job to monitor.
Download allows you to download the results or s-parameters. These are saved in a folder with same name as the job ID inside the /<project-name>.aedtdownload folder (or /<project-name>.aedtzdownload folder, if the submission was based on an archive). You can also select the Auto Download Results check box to have the results downloaded to this location automatically.
Monitoring Large Scale DSO Jobs
For Large Scale DSO submissions, the Monitor Job window includes the following items:
- Show Messages in Node Tree – Instead of viewing job details, you can select this option to view nodes and tasks in a tree format.
- Drop-down boxes allow you to filter which Nodes and Tasks to display in the tree.


To leave this mode, select Show analysis details.
Web Client for Batch Solve Monitoring and Reporting
There is a Beta Option to use a Web client for batch solve monitoring and reporting. If you set the Beta Option f under General for Enable Web Client for Monitoring, you will have access to the feature.
After you have selected the scheduler to use, when you access the Submit Job To: dialog, you well see Enable Web Client checked.
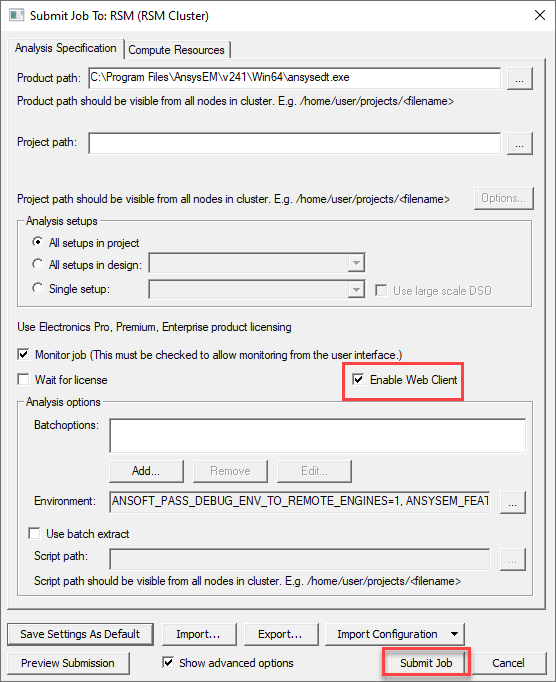
After specifying the project path and setting other parameters, you can then select Submit Job. This opens the Monitor Job dialog for your scheduler. Once the Job Status changes to Running, press Open Web Client.
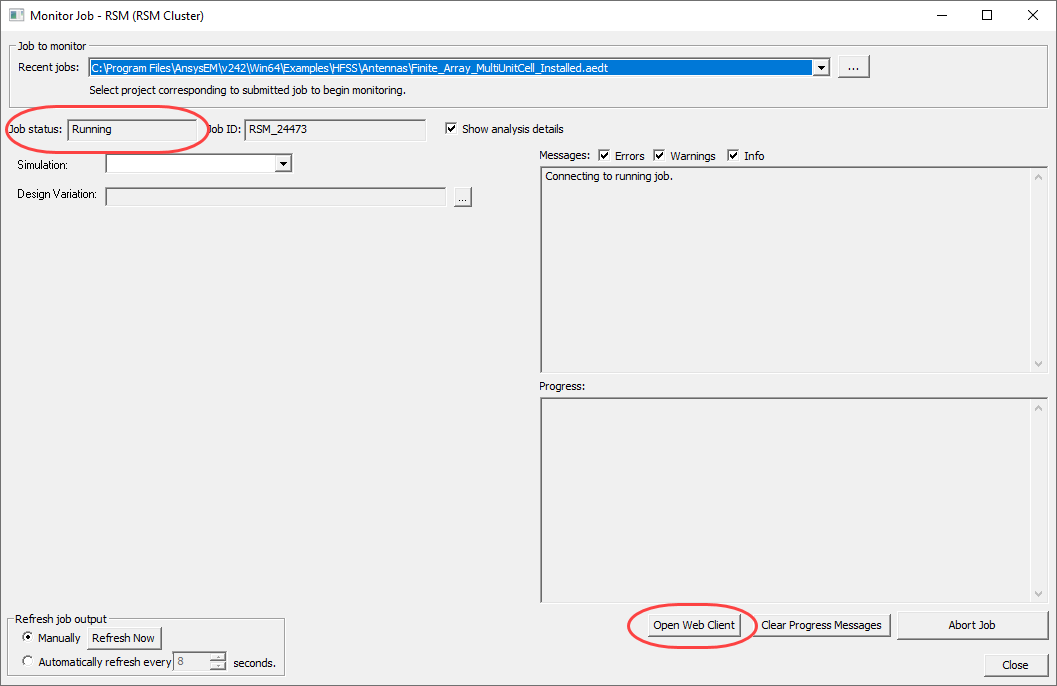
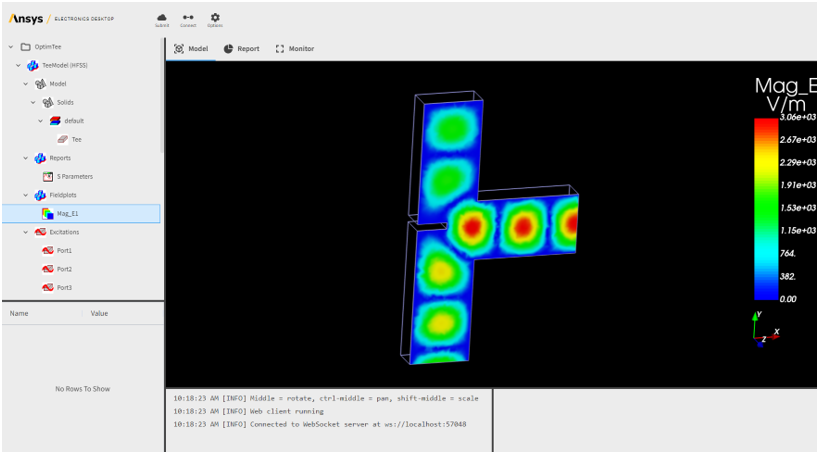
Click Open Web Client to open the Web Client in your default browser.
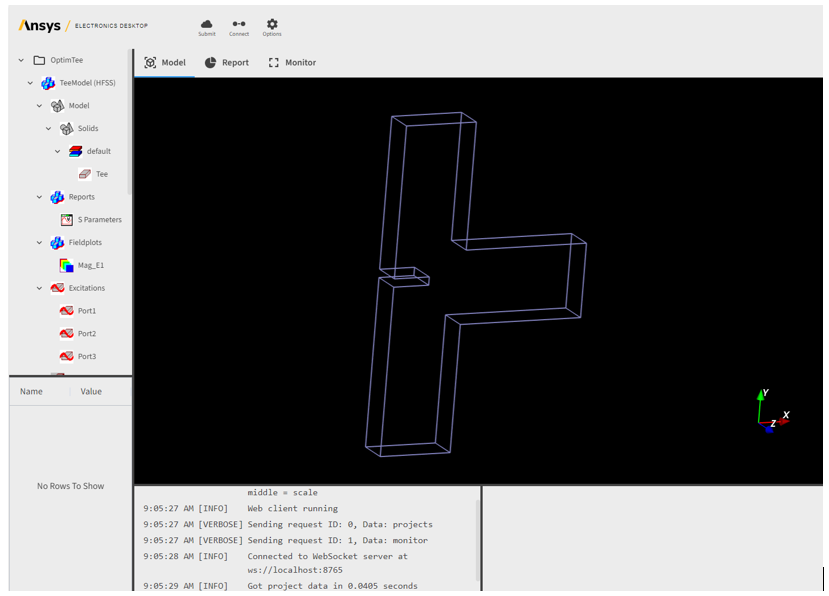
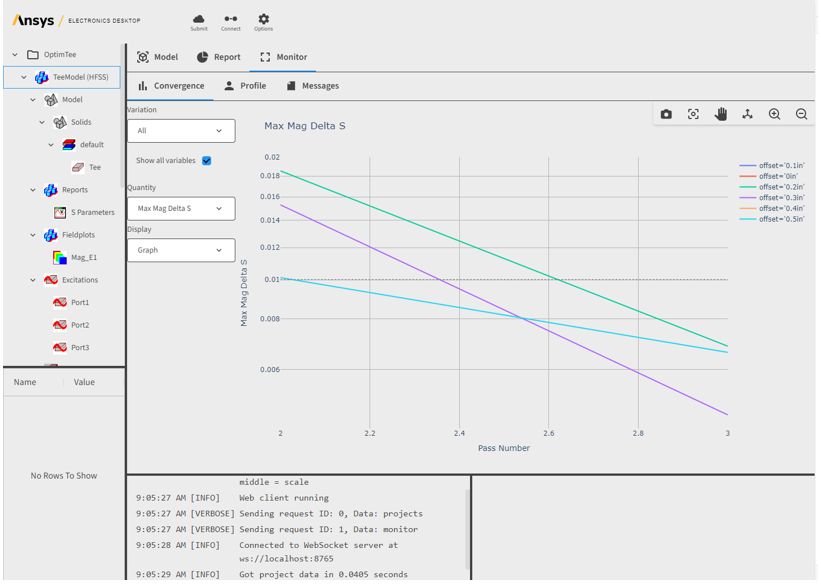
Switch to the Monitor tab to gain access to the subtabs for Convergence, Profile and Messages.
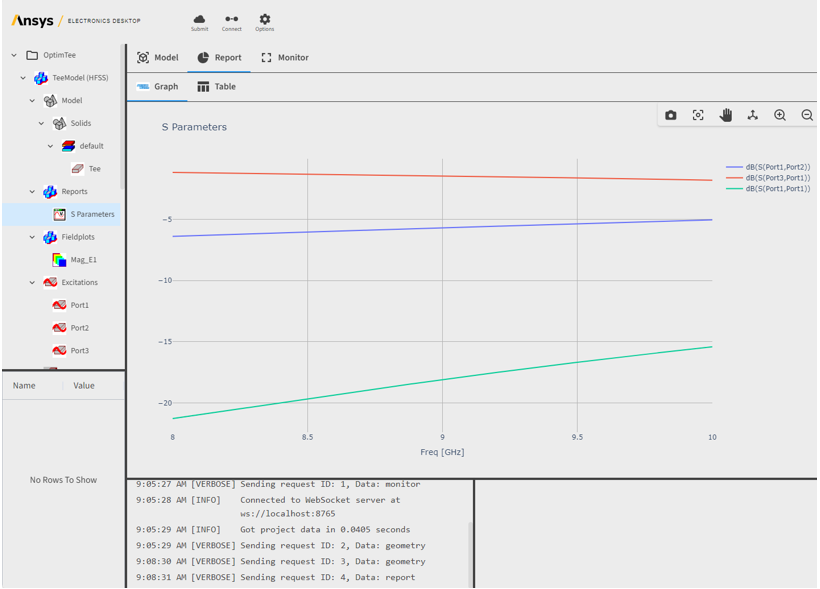
Select a Report in the Project Tree to view it.
Select a Field Plot in the Project Tree to view it.