
Viewing a Solution Profile
At any time during or after the solution process, you can examine the computing resources or profile data that were used by Ansys Electronics Desktop solvers during the analysis. The profile data is essentially a log of the tasks performed by Ansys Electronics Desktop during analysis. The log indicates the length of time each task took and how much physical and disk memory was required.
- In the Project Manager tree, right-click a solution
setup, and select Profile.
The Solutions window appears, with the Profile tab selected. You can also click the Solution Data icon on the ribbon to open the Solutions window, and then select the Profile tab.
The displayed data depends on the type of problem and solution setup.
A Beta feature (Enhanced Profile Display] allows you to have the Profile data is displayed using nested subgroups. The Details buttons compress groups [<<] and [<] and expand them [>] and [>>].
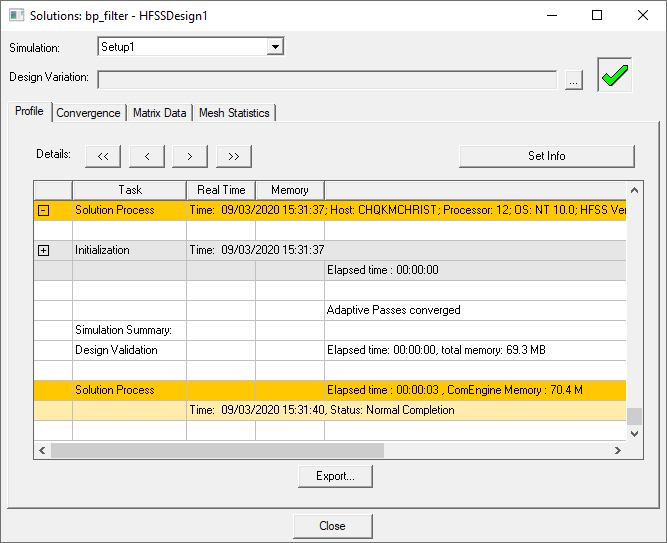
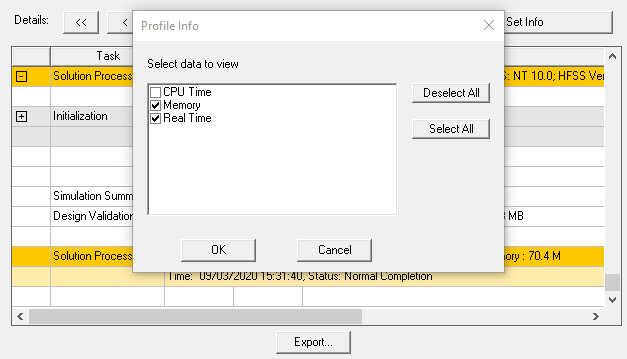
The Profile data is displayed using nested subgroups. The Details buttons let you compress groups [<<] and [<] and expand them [>] and [>>]. You can also click the [+] buttons in the first column to open a subgroup, or use a [-] button to close one. The Set Info button lets you select from available Profile information.
- If one or more setups exist, you can select the desired profile
information from the Simulation drop-down menu. In general, the information displayed includes
Task
Lists the type of task that was performed. The Tasks lists included Start, various Mesh tasks, Simulation Setup, Port Adaptation, Adaptive Pass tasks, including simulation setup, Matrix Assembly, Solver tasks, and Field Recovery, Sweep tasks, and Solution Process summary and Totals for time.
Real Time
The difference in time between the start of the task and the end of the task (elapsed time).
CPU Time
The amount of CPU time required to perform the task.
Memory
The peak amount of physical memory (RAM) used by the individual executable running the task. The memory is freed for other uses after each task is complete.
Information
General information about the solution, for example, the number of tetrahedra used in the mesh, disk use, solver information, sweep information, the elapsed time, and the memory used by the MaxwellComEngine, and totals.
The elapsed time is the difference between the time in the Start line and the time in the Total line — how long the task actually took between when Analyze was clicked and when the simulation finished. The elapsed time is a little greater than the Real Time given in the Total line. This is because the Total line contains the sum of all of the real times reported by the individual processes and does not include the typically small amount of time the Maxwell ComEngine uses before, after, and in between calling the other executables.
The matrix solver writes specific information in some of these fields as outlined below:
Task
The matrix solver task reports the type of solution performed by the solver, based on the physics of the problem. It has the form "Solver pdsn" (e.g. Solver MRS2 or Solver DCS4-L2), where
- p, the precision type is: M (mixed for direct solver) or D (double for direct and iterative solver).
- d, the matrix data type is: R (real) or C (complex)
- s, the symmetry type is: S (symmetric), A (asymmetric), or H (hermitian)
- n, the number of processors used. You specify the number of available processors on the local machine in the Maxwell options. If a solve does not use all available processors (local or distributed), the number reported may be less than the number available.
If a simulation uses the iterative solver, the Solver designation can include a level indicator appended. to an Iterative solver designation (L2 in the example above). The higher the Level number the lower the memory, you will never see L1 (this would be equivalent to direct solver. And a first order solve will only display L2 since it only has one level of order to go down for preconditioning. A second or mixed order solve may display L3 depending on the mesh quality.
If the solver switches from the Iterative Solver to the Matrix solver, you see a Matrix solver warning: Switch from Iterative Solver to Direct Solver.
Information:
The matrix solver information line includes, for example, Disk = 0 KBytes, matrix size 11137 , matrix bandwidth 20.3 )
- Disk: The amount of hard disk space used during the calculation of the matrix solution. If the disk usage for matrix solver is non-zero in profile, it usually indicates off-core matrix solver. If the matrix solver must solve off-core, smaller blocks of the data to be solved are created on disk, each block is then solved in physical memory, and then the matrix solution is reassembled. As a result of this additional processing, the time required to calculate a solution is higher.
- Matrix size: The size of the matrix that was solved (the number of unknowns)
- Matrix bandwidth: An FEM matrix is a sparse matrix. The solver only stores the non-zero entries. The matrix bandwidth is the average number of non-zeros per row. It gives an idea of the sparsity of a FEM matrix. Storage for the sparse matrix is proportional to the total number of nonzeros = #rows x bandwidth. The higher the bases order, the larger the bandwidth.
- In the case of the Iterative Solver, # Iterations
To export the profile data:
- Open the Solutions dialog box with the Profile tab selected.
- Click the Export... button.
- Click Save.
This opens a file save dialog that lets you provide a file name and location.
The data is saved in a text file with a .prof extension.