
Specifying a J-E Curve for Nonlinear Bulk Conductivity
When you define a new material or edit an existing material in the View /Edit Materials window with a nonlinear bulk conductivity, you need to specify the current density vs. electric field characteristics (J-E Curve).
-
Open the View / Edit Materials dialog from the Edit Materials window either by:
- Selecting an existing material that you need to edit, and click View / Edit Material.
- Clicking Add Material.
Any of these actions open the View/ Edit Materials dialog box.
- For the Bulk Conductivity select Nonlinear as the Type. A J-E Curve button appears in the Value column.
-
Input the J-E curve by clicking the J-E Curve button opens the JE Curve dialog box.
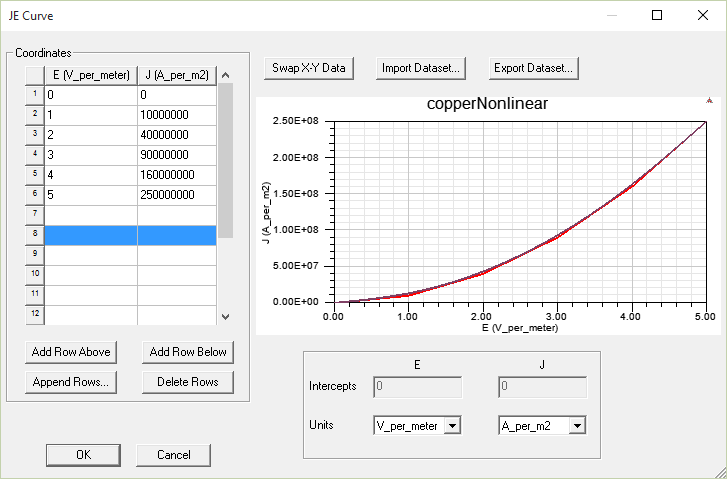
-
Set the Units for J and E by selecting from the drop down menus.
For a material property without an existing J-E curve definition, the dialog opens with an empty list of coordinates.
-
Enter J and E values in each row of the Coordinates table. Placing the cursor in a table cell enables the Add Row Above, Add Row Below, and Delete Rows buttons.
- The slope of the curve can not be less than 0.
- The values of J and E must increase along the curve.
- The initial values of J and E must be 0 (zero) - the curve must begin at the origin.
- Because J-E operating points in the FEA solution may extend beyond the input J-E data set, the J-E data set is extrapolated. The slope of the last two user-defined data points is used to extrapolate the J-E curve.
- The data points representing the J-E curve should have enough points for accurate representation of the curve. A minimum of three data points must be specified. Twenty (20) or more points should be specified with increased representation on the "knee" of the curve.
- Add Row Above
- Add Row Below
- Append Rows (to specify the number of rows to append to the table)
- Delete Rows
- Optionally, click Import Dataset to import J-E curve data from a file, and if they are in the wrong columns, click Swap X-Y Data to switch the J values and E values in the graphics display. You can also use the SheetScan tool to extract curve data from sources such as manufacturer datasheets to a dataset, which can then be exported to a tab-delimited file, and imported via Import Dataset. (Refer to Adding Datasets and Exporting Datasets for related information on working with datasets. Refer to Using SheetScan for working with the SheetScan tool.)
-
When finished entering data, click OK to close the window.
When you OK the dialog box, an error message displays if a slope is out of tolerance, identifying the out of tolerance parameter. Out of tolerance data points must be corrected before you can successfully exit the dialog.
Note the following requirements for creating a valid curve:
As you enter values, the graph is updated.
To Add or Edit rows, you can click the following buttons: