
Report 2D Options: Stacked
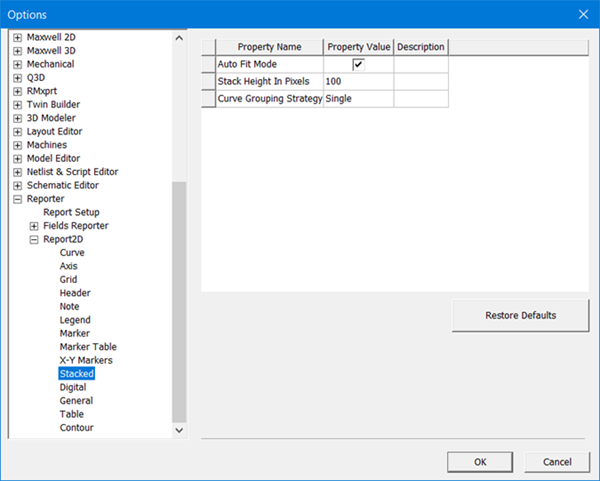
Stacked settings change how stacked plots are displayed in reports. These options are set on the Stacked panel under Report2D in the Options window.
-
Auto Fit Mode – On or Off
-
Stack Height in Pixels – sets the default stack height
-
Curve Grouping Strategy – can be Single, By Trace, or By Units. Single means that a new stacked plot shows a single curve per stack. By Trace means that all curves are grouped by their trace. By Units means that all curves are grouped by their unit type.
If you change the Curve Grouping Strategy set by default, existing stacked plots remain unaffected. The new default will apply only to new stacked plots.
When a project containing stacked plots saved in versions before 19.0 is opened in version 19.0, Curve Grouping Strategy will default to Single and the stacked plots remain unaffected.