
Adding Characteristics Using the Add Trace Characteristics Window
You can add characteristics to a selected trace by selecting from the Add Trace Characteristics window.
To add additional characteristics to a selected trace:
- Select a trace in a report plot or legend.
- Click Report 2D > Trace Characteristics, or right-click on the selected trace to display the shortcut menu.
- Select All.
This displays the Add Trace Characteristics
window.
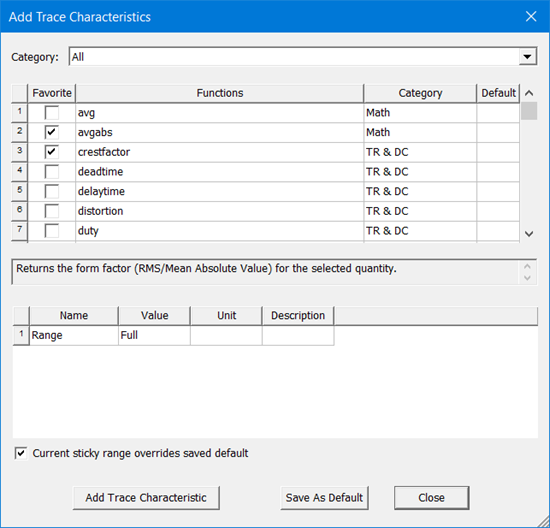
- Select the Category.
The available categories depend on the plot, and the selecting of a category
displays its associated functions.
Category
Functions
Recent
Displays the most recent functions used, sorted by the time they were added.
Favorites
Displays all favorites. The defaults are avg, max, min, and pk2pk.
All
Displays all available functions.
Math
avg, avgabs, integ, integabs, max, mean, min, pk2pk, pkavg, ripple, rms, rmsAC, stddev, sum, variance, XatYMax, XatYMin, XatYVal, XWidthAtYVal, YatXMax, YatXMin, YatXVal
PulseWidth
pulsefall9010, pulsefront1090, pulsefront3090, pulsemax, pulsemaxtime, pulsemin, pulsemintime, pulsetail50, pulsewidth5050, pw_minus, pw_minus_avg, pw_minus_max, pw_minus_min, pw_minus_rms, pw_plus, pw_plus_avg, pw_plus_max, pw_plus_min, pw_plus_rms
Overshoot/ Undershoot
overshoot, overshootAbs, undershoot, undershootAbs
TR & DC
crestfactor, deadtime, delaytime, distortion, formfactor, fundamentalmag, risetime, settlingtime
Error
iae, ise, itae, itse
Period
per, pmax, pmin, prms
AC
gainmargin, phasemargin, gaincrossover, phasecrossover, lowercutoff, uppercutoff, bandwidth, peakgain, peakgainfreq
Radiation
lSidelobeY, rSidelobeY, lSidelobeX, rSidelobeX, xdb10Beamwidth, xdb20Beamwidth
Eye Measurements
EyeLevelZero, EyeLevelOne, EyeAmplitude, EyeHeight, EyeSignalToNoise, EyeOpeningFactor, EyeWidth, EyeJitterP2P, EyeJitterRMS, EyeRiseTime, EyeFallTime, MinEyeWidth, MinEyeHeight
TDR
Shunt_C_in_pF, Series_L_in_nH
- Some categories and functions call for you to specify one or two additional values in a table. You can save these values using the Save as Default button. The Default column shows a Y if there is a saved default value for the function.
- Select the Current sticky range overrides saved default check box if you do not want the range value in the table to be changed when the function selection is changed: the current range value becomes the “sticky range.” If the check box is not checked, the range value is updated from the saved default values and becomes a new sticky range.
- Click the AddTrace Characteristic button to add the specified characteristics to the trace.
- Click Close.
For a selected function, the Add Trace Characteristics window displays the function’s purpose in a text field.
Related Topics
Adding a Characteristic to a Trace
Adding Trace Characteristics to your Favorites
Removing All Trace Characteristics