Adding 3D Datasets
In Maxwell designs, you can define both project-level and design-level 3D datasets. Use a project-level 3D dataset to define material properties that vary according to the spatial coordinates. Use a design-level 3D dataset to define temperatures that vary according to the spatial coordinates.
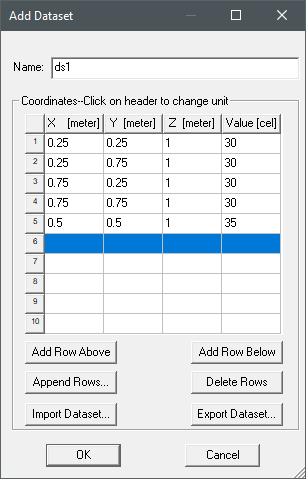
To define a 3D dataset, specify a list of X, Y, and Z coordinates and the corresponding Values in the Add Dataset window. For example, the first line in the image below specifies a temperature of 30° C at (0.25, 0.25, 1). The data specifies a variation of temperature on the plane 0.25 ≤ X ≤ 0.75, 0.25 ≤ Y ≤ 0.75, Z = 1. In this example, the values in the Values column are temperature, but can be set to a different unit depending on the property you wish to assign.
To change the unit:
- Click the X, Y, Z, or Value header row.
- Depending on whether you are defining a
project-level or design-level 3D dataset, choose the appropriate one of the following two options:
- For project-level datasets (material properties):
From the menu bar, select Project > Datasets or
on the Desktop ribbon tab, click
 Datasets.
 - For design-level datasets (temperatures): From the menu bar, select Maxwell > Design Datasets.
The Datasets window appears; it lists any existing datasets.
- For project-level datasets (material properties):
From the menu bar, select Project > Datasets or
on the Desktop ribbon tab, click
- Click Add > Add 3D Dataset.
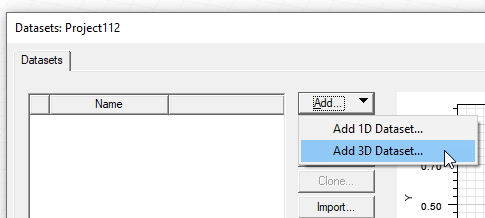
The Add Dataset window appears.
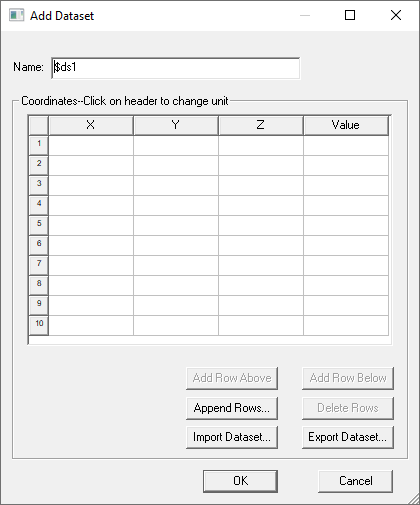
The window contains fields for the dataset name, a table for X, Y, and Z coordinates, and corresponding values. It can be resized to display additional rows and columns and includes buttons for the following functions:
- Add Row Above – adds a new row to the table above the selected row.
- Add Row Below – adds a new row to the table below the selected row.
- Append Row – opens a dialog box that lets you specify a number of rows to add to the table.
- Delete Row – deletes the selected row or rows.
- Import Dataset – this provides a way to import data sets from an external source. The format is a tab separated points file. Clicking the button opens a file browser window.
- Export Dataset – this provides a way to export the current dataset to a tab separated points file. Clicking the button opens a file browser window.
- Optionally, type a name other than the default for the dataset in the Name field.
- Click the X, Y, Z and Value column headers to select a
unit category. The default is No Unit.
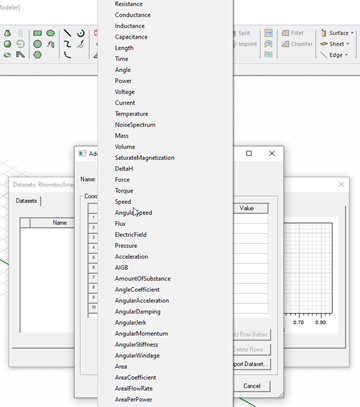
Click the header again to select a unit in that category. You can select No unit.
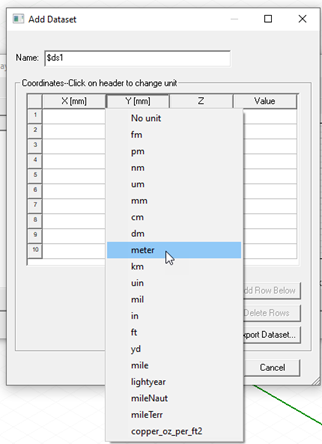
Selected units are displayed for each column in the header cell.
- Enter the X, Y, and Z coordinates and the corresponding values by one of the following methods:
- Import Dataset
- Type coordinates and associated value in the X, Y, Z, and Value columns.
- When you are finished entering the data point coordinates and values, click OK.