To open the results of a Quick Eye analysis, click the Results icon in the Project Manager window and select one of the Create Report options. There are many ways to plot the data; this topic gives examples of a Statistical (Sampled) Eye Diagram, a 2D Bathtub curve,standard and statistical Eye diagrams with PAM4 modulation, and a 2D Bathtub plot with PAM4 modulation.
For bathtub curve of QE, distinguish simulated/extrapolated regions using a partitioning horizontal line via the ‘SimulatedLimit’ option that is in available the ‘Quantity’ column. Such processing allows for the robust extrapolation of bathtub curves arising out of QE and AMI analyses.
2D Contour Plot
The contour plot of the bit error rate at times within the unit interval. To view the data as a contour plot of the bit error rate, select Create Standard Report > Rectangular Contour Plot. From the Report window, select UI as the Domain and Eye as the Category. Click New Report.
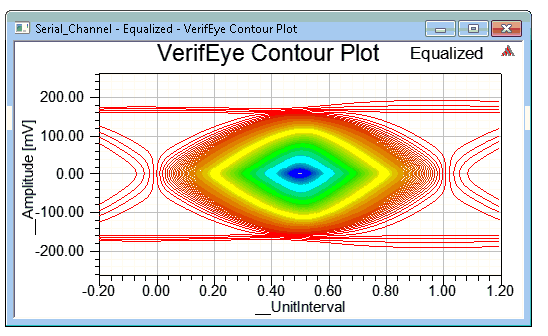
The contours for AEYEPROBE represent the bit error rates using logarithmic scaling. Amplitude represents the voltage transitions and UnitInterval is the location of the data relative to the unit interval.
2D Bathtub Plot
To view the VerifEye data as a 2D bathtub curve, select Create Standard Report > Rectangular Plot. From the Report window, select UI as the Domain and Bathtub as the Category. Click New Report.
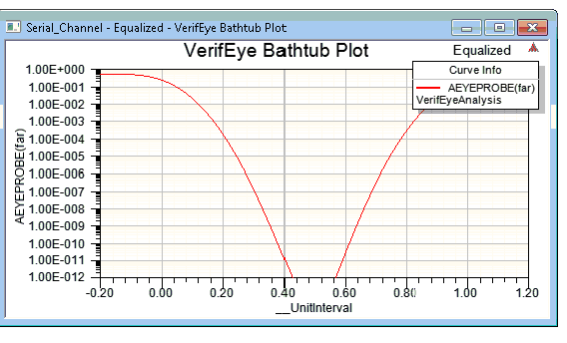
This graph shows the BER at various locations in the unit interval. The amplitude is set at the midpoint of its value range. The BER values are on the Y-axis using logarithmic scaling and a minimum of 1e-16 ~ e-21.
2D Step Response Plot
To open the initial step response of the channel as calculated by VerifEye:
- Under Reports, select Create Standard Report > Rectangular Plot.
- Click the Domain drop-down menu to select Initial Response. Click New Report. The report shows the initial response of the channel in the time domain
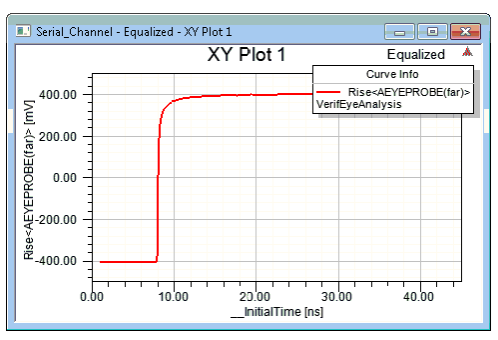
VerifEye Data Table
To open the VerifEye data as a table, select Create Standard Report > Data Table on the Results menu. Select Bathtub as the Category, the name of the Eye probe as the Quantity, and <None> as the Function. Click New Report.
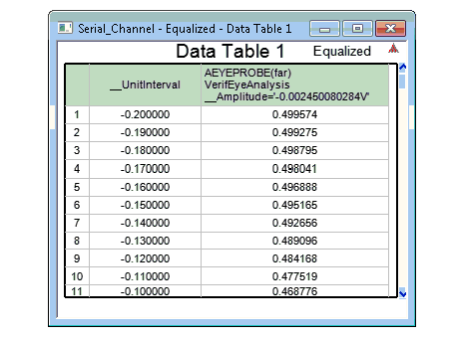
2D PAM4 Statistical Eye Diagrams
To enable PAM4 modulation, set the modulation parameter in the Eye source to PAM4. Select Gray or Linear for the coding parameter as applicable. When analysis completes, select Create Statistical Eye Diagram > Rectangular Plot.
The plot shows four voltage levels, each one corresponding to a transition between two bits. This example uses the default Gray coding: the lowest level represents 00, the next higher level represents 01, the next higher level represents 11, and the highest level represents 10. The four voltage levels form three eyes in the diagram.
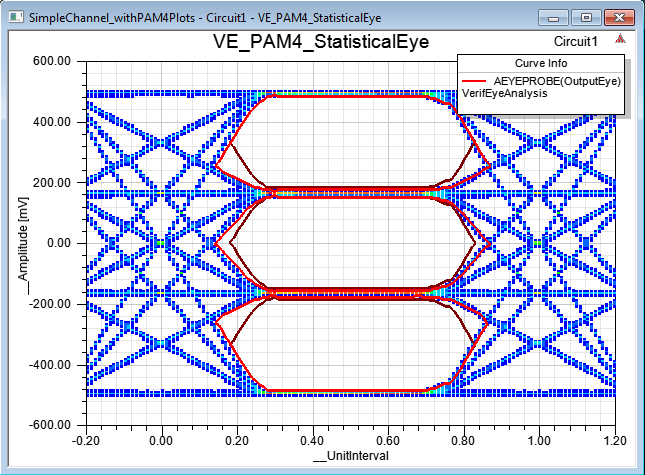
The red lines show the eye openings. The dark lines show the intersection of all three eye openings.
2D PAM4 Bathtub Plots
To enable PAM4 modulation, set the modulation parameter in the Eye source to PAM4. Select Gray or Linear for the coding parameter as applicable. When analysis completes, select CreateStandard Report > Rectangular Plot. From the Report setup, click the Families tab and edit the _EyeOpening family. The entries are -101 (combined error rate), -1 (upper eye error rate), 0 (middle eye error rate) and 1 (lower eye error rate). From the Report window, select UI as the Domain and Bathtub as the Category. Select the <Bit Error Rate> trace to see the bit error rate.
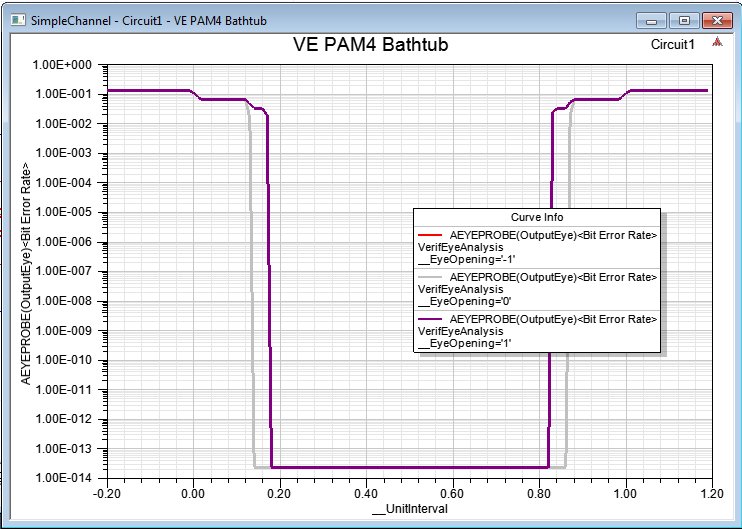
The example plot shows the separate bit error rates for the three PAM4 eyes (-1, 0, and 1 selected).
The bathtub curve for a PAM4 simulation can show the symbol error rate instead of the bit error rate. With PAM4, a symbol is two bits. The report setup is the same, but now select the <Symbol Error Rate> trace.
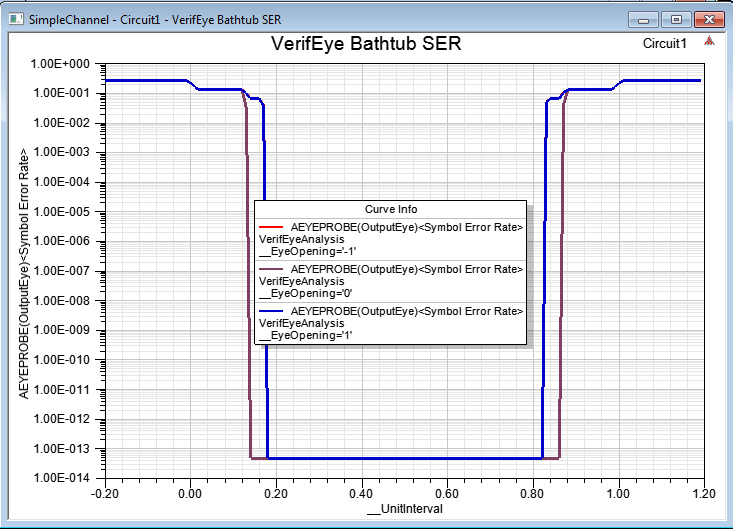
2D PAM4 Contour Plots
To enable PAM4 modulation, set the modulation parameter in the Eye source to PAM4. Select Gray or Linear for the coding parameter as applicable. When analysis completes, select CreateStandard Report > Rectangular Contour Plot. From the Report setup, click the Families tab and edit the _EyeOpening family. The entries are -101 (combined error rate), -1 (upper eye error rate), 0 (middle eye error rate) and 1 (lower eye error rate.
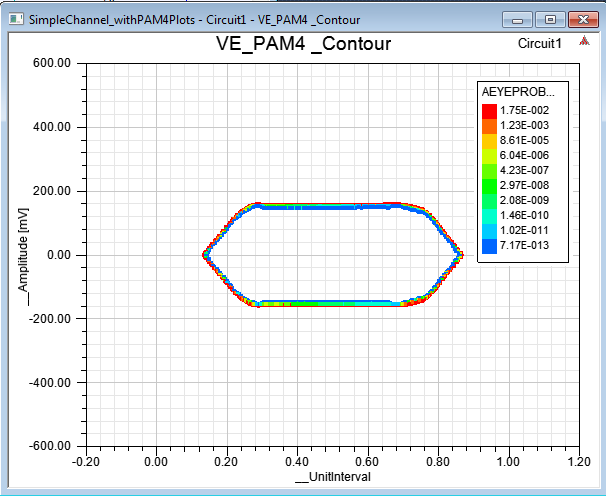
The example plot shows the separate bit error rates for the three PAM4 eyes (-1, 0, and 1 selected).
