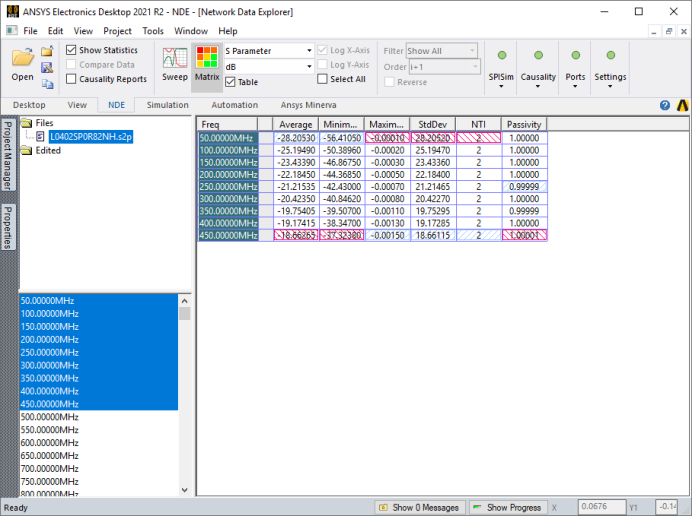
Displaying Matrix Statistics by Frequency
Network Data Explorer can display various statistical measurements.
- On the NDE ribbon:
- Click Matrix.
- Click Table.
- Click Show Statistics.
- In the Cell and Frequency Selection pane, select frequencies to display.

Click a column header to sort data by that column.
Hover the cursor over a cell to view information about it.
Only real (not complex) data formats are offered for statistical analysis. Passivity is only available for S-parameter data (comparisons inactive). NTI refers to the number of trivial items; for S-parameters, this includes all zeros and ones; for all other data (and data comparisons), only zeros are counted as trivial. The minimum value for each column is highlighted in blue; the maximum is highlighted in red.
