Changing Dataset Plot Properties
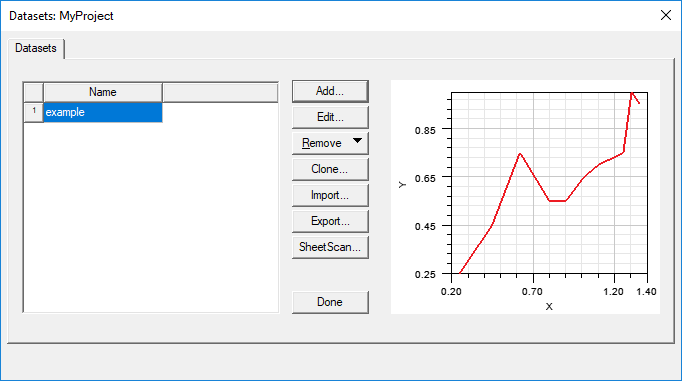
From the Datasets window, you can change the appearance of a dataset's plot.

To change a plot's appearance:
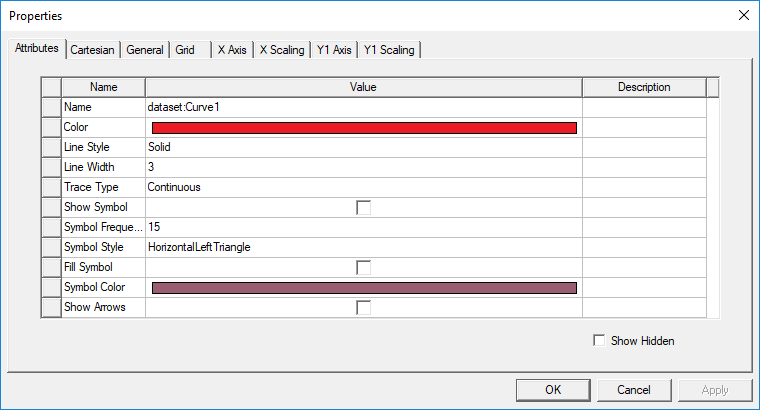
- Double-click a plot element (for example, a line, axis, or title) to open that element's Properties window.

- Set the colors, fonts, and styles as applicable and as desired.
- Click Apply.
- Click OK to exit the Properties window.
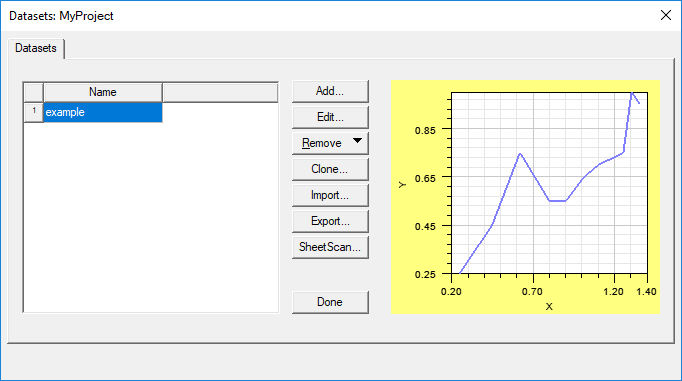
The plot now displays as specified.

