
Modifying the Field Plot Scale
To change how field quantities are scaled on the field overlay plot:
- Click
 Modify Plot Attributes or, in the Project Manager, right-click Field
Overlays and select Modify Plots from the shortcut menu (or use the "m" hotkey).
Modify Plot Attributes or, in the Project Manager, right-click Field
Overlays and select Modify Plots from the shortcut menu (or use the "m" hotkey). - Select the plot folder you want to modify and click OK.
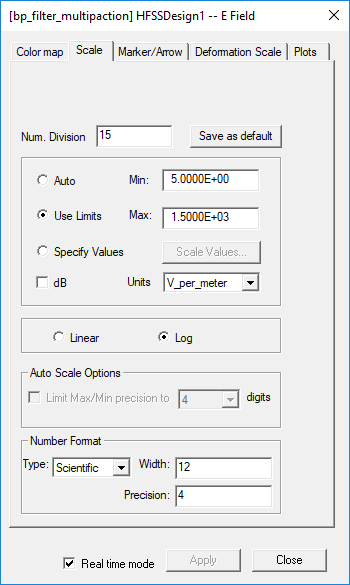
- Click the Scale tab.
- Optionally, to change the number of divisions in the field plot scale, set the Num. Division field to a new value. You can click Save as Default, if desired.
- Select one of the following scale options:
- Optionally, use the Units drop-down menu to select the default unit of measure for the plot.
- If you selected Use Limits, enter the lowest field value to be plotted in the Min. text box and the highest field value to be plotted in the Max. text box.
- Actual computed Min
- Max/pow(10, num digits of field precision)
- If you selected Auto or use Limits or dB, you can select one of the following options:
- Specify the Number Format for the plot as Auto, Scientific Notation, or Decimal. You can also specify Width and Precision for the plot.
- Select Real time mode if you want the changes to take effect immediately in the view window.
- Optionally, you can use the Save As Default button to save the following to the registry:
- Whether to limit field precision
- The number of digits of field precision
- Whether to use log/linear scale
- Whether to use dB
- Click Close to dismiss the dialog box.
The Select Plot Folder dialog box appears.
All plots in the selected folder will be modified.
A dialog box with attribute settings for the selected folder appears.
| Auto |
The full range of field values will be plotted on the selected surface or volume. Selecting Auto enables the Auto Scale Options and disables the Min and Max fields. By default, precision is not limited and auto-min is the actual computed min on the plotted geometry. |
| Use Limits |
Only the field values between the minimum and maximum values will be plotted. Field values below or above these values will be plotted in the colors assigned to the minimum or maximum limits, respectively. Selecting Use Limits enables the Min and Max fields and disables the Auto Scale Options. Field values have a precision of at most 6 decimal places (field solution files are saved in floating precision), so Min/Max numbers are displayed to this precision. |
| Specify Values |
This enables a Scale Values button. |
Optionally, when dB is checked, dB scale is used for the plot. It disables the Units field, Linear and Log and have "Linear" selected.
The units specified here appear on the Color map for the fields plot, and for the properties dialog for the field quantities.
If you selected Auto or Use Limits without having dB checked, the Auto Scale Options are enabled. You should only changed for cases where auto-min is a small number. Use the 'Limits Max/Min precision to' check box to enable setting the drop-down menu for the precision limit.
The auto-min is the greater of the following:
If you selected Specify Values, you can click the Scale Values button. This opens a dialog with an editable, scrollable list of the current scale values. To apply the changes you make, click OK. To close the dialog box without making changes, click Cancel.
| Linear |
Field values are plotted on a linear scale. |
| Log |
Field values are plotted on a logarithmic scale. If field plots have negative and positive values and when auto-scale is selected, the log-scale choice automatically sets the Min value as the Max/Min Ratio. (If field plots have all negative values, Log is not allowed.) |
If this option is cleared, click Apply when you want to see the changes.
Auto scale is the default for new plots. For scalar-in-volume plots, iso-surface (rather than cloud) is the default display