
Modifying Scalar Field Plot Isovalues
- Click
 Modify Plot Attributes.
The Select Plot Folder window appears.
- Select the plot folder you want to modify, and then click OK.
All plots in the selected folder will be modified.
A dialog box with attribute settings for the selected folder appears.
- Click the Plots tab.
If you have more than one plot, a drop down lets you select. The OnSurface tab appears for surface plots and InVolume for volume plots.
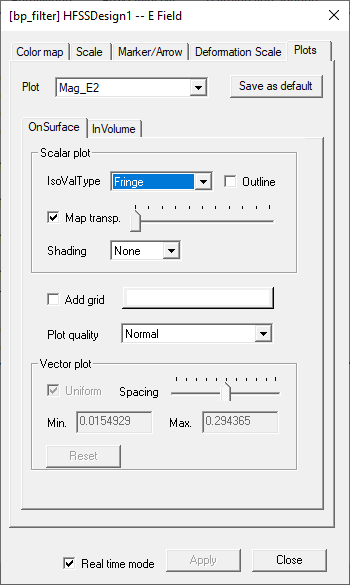
- If the plot is a scalar surface plot, do the following:
- Select one of the following isosurface display types in the
IsoValType drop-down menu:
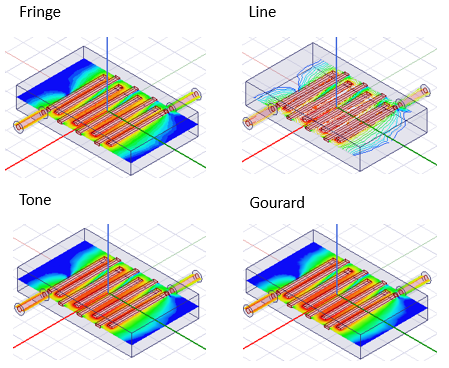
Line
Lines are drawn along the isovalues.
Fringe
Color is constant between isovalues.
Tone
Color varies continuously between isovalues.
Gourard
Color varies continuously across the plot.
- Optionally, if you selected Fringe or Tone, select Outline to add a border line between isovalues.
- For shading on OnSurface plots, if you are using Lighting, you can adjust the Shading as None, Flat, or Smooth.
- Select one of the following isosurface display types in the
IsoValType drop-down menu:
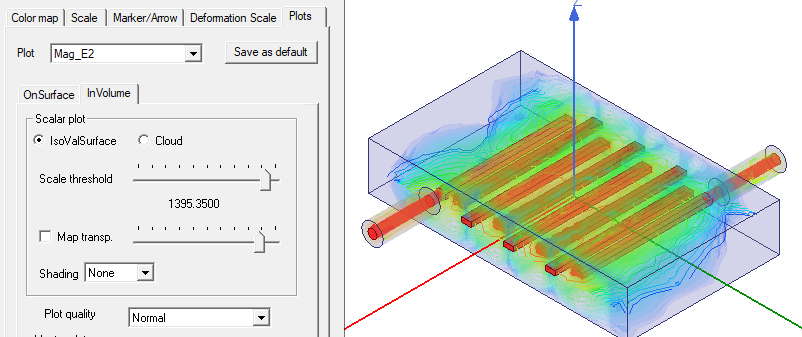
- If the plot is a scalar volume plot, do the following:
- Select one of the following display types:
IsoValSurface
Color is drawn on the isovalues. This choice includes “Scale threshold” slider barthat allows you to set a field value threshold so that iso surfaces with field value lower than the given threshold will show as translucent with given transparency specified by the slider bar below it. When "Map transp." is checked, translucent iso surfaces field values map to [0.0, transparency] so lower field value map to higher transparency while higher field value to lower transparency. If it is unchecked, all translucent iso surfaces will have the same given transparency from the slider bar.
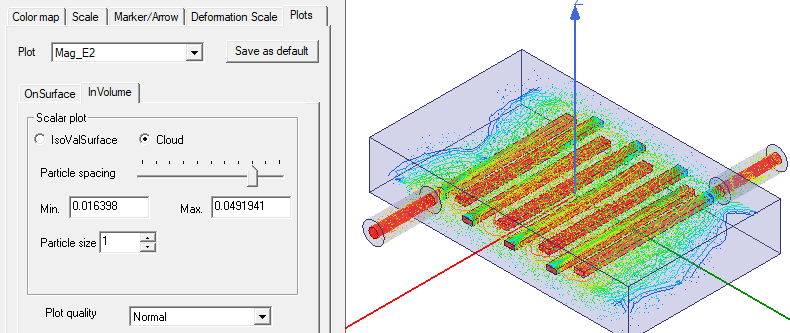
Cloud
Field values are represented by points that illustrate the spatial distribution of the solution. The higher the solution value, the greater the cloud density. You can adjust particle spacing, Min. and Max, values, and Particle size.
- Select one of the following display types:
- Select Real time mode if you want the changes to take effect immediately
in the view window.
If this option is cleared, click Apply when you want to see the changes.
- Click Close to dismiss the window.