Limit Lines in Cartesian Plots
Limit lines are simple graphical representation of constraints on XY plots. These are modeled as a sequence of XY point pairs, or as offsets from a selected curve. You can designate a single limit line to delineate an upper limit, or two lines to delineate upper and lower limits, or upper and lower offset lines simultaneously.
You can control the display properties of the line including color and hatch width in pixels. These lines are available only on XY plots (and not on the XY-like plots: bode, stacked etc)
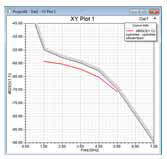
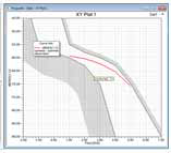
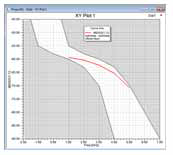
Limit lines are available only on Rectangular (XY) plots, not on XY-like plots such as Bode or Rectangular Stacked. On 2D Plots, the axes extents are based on the extents of the curves.
To create a limit line:
- Click Report2D> Add Limit Line or right-click an XY plot and select
Add Limit Line... from the Context menu. You then select whether to Specify
Points, or From a Selected Curve, or Specify Equation.

Select Specify Points to open an Edit Dataset dialog box so that you can specify points.
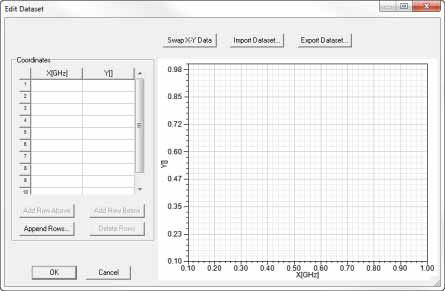
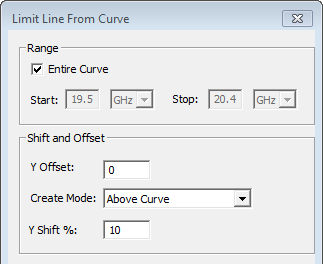
Select From Selected Curve to open the Limit Line From Curve dialog box.
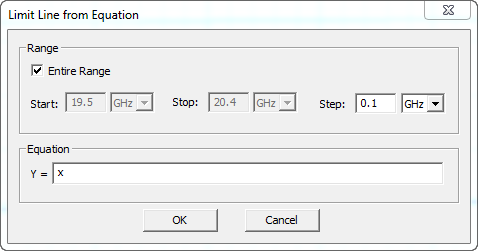
Select Specify Equation to open the Limit Line from Equation dialog box.
- You can use the Edit Dataset dialog box to:
- Enter the EY values directly.
- Import XY values from a .tab file.
- Export Dataset to a file.
If you require additional data points, you can use the buttons to Append Rows to the Coordinates table. If you select a row in the Coordinates table, you can then use the buttons to Add Row Above, Add Row Below the selected rows, or Delete Rows.
You can use Shift+click to select multiple adjacent rows, or Ctrl+click to select any rows for deletion.
Note:Each limit line is associated with a particular Y axis (because it has to be scaled the same way as all the curves associated with the axis, follow its log/linear scale and so on). This Y axis association defaults to the first available Y axis when the limit line is created. However, if the plot contains multiple Y axes, it can be associated with a different Y axis later via its properties tab.
- You can use the Limit Line From Curve dialog box to create a limit
line with a:
- Range using the Entire Curve, or a specified Start and Stop.
If you uncheck “Entire Curve,” the Start and Stop fields are enabled and initialized based on the zoom level.
- Shift and Offset relative to the Y, either as a Y Offset value or as a Y Shift %.
- Create Mode as Above Curve, Below Curve, or Above and Below Curve.
- You can use the Limit Line from Equation dialog box to create a limit
line based on an equation in the form Y = f(x).
- Only x variable is allowed
- x value is linearly sampled and f(x) is evaluated to get y. By default, the entire range for plot is covered. You can uncheck Entire Range to specify Start and Stop. You can always edit Step and unit values for x.
- If y results in NaN, an error is indicated and limit line is shown.
- If y results in Inf value, then it maps to the MapInfValue specified on its associated y axis.
- Selecting the limit line added in such a way should show: Start, Stop, Step, and Equation in limit line property window. You can edit these values in the Properties window.
- Once you Click OK, the limit line, or lines, you
define are added to the plot. Each limit line divides the plot into two regions
within the context of its length. By default, the upper region is hatched
to designate constraint violation.
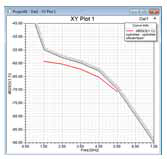
- You can select the limit line in the plot to edit its properties via the
Limit Line tab of the plot properties.
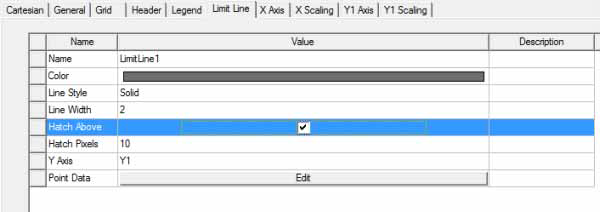
- Line properties: Color, Style and Width
- Y axis association
- Hatch properties
- Hatch width in pixels
- Hatch direction (hatch above or below the Limit line)
- The point definition of the limit line itself.
For a limit line specified as an Equation, the Properties also include:
- Start, Stop, Step, and Equation values.
- If you add a second limit line, you can
designate it as hatch below by unchecking Hatch Above to produce
a tunnel marking upper and lower constraints.
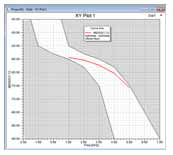
The following example shows the a limit line from curve plot, where the Hatch Above property for the lower limit line has been unchecked.
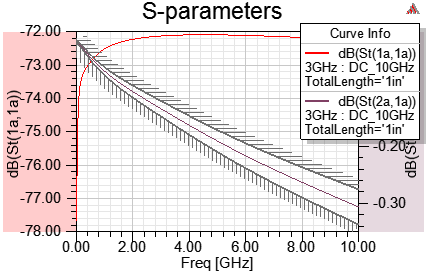
Limit Line Violations
You can use a plotting feature to help you discern whether a curve violates a limit line or not. Consider following plot which shows two curves:
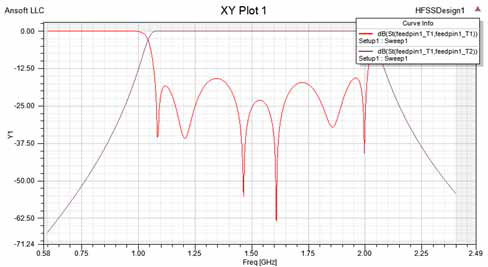
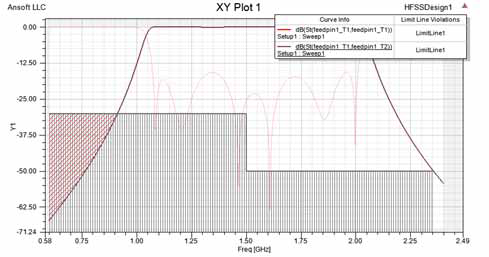
Suppose that the response cannot be below -30 dB until 1.5 GHz, and cannot be below -50 dB at 1.5 GHz or higher. You add a limit line for this requirement in the plot using 'Add a Limit Line' functionality. The plot automatically calculates whether a curve violates this requirement, that is, the limit line and show it in the legends window, as shown in following figure:
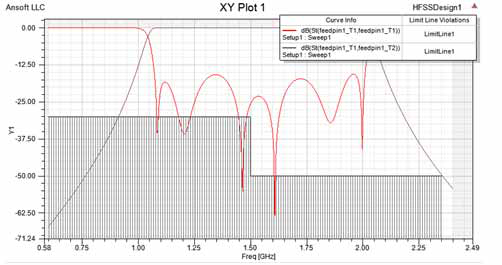
If a curve is selected, then the plot shows the region of the curve that violates the limit line (shaded with slanted red lines), as shown in following figures:
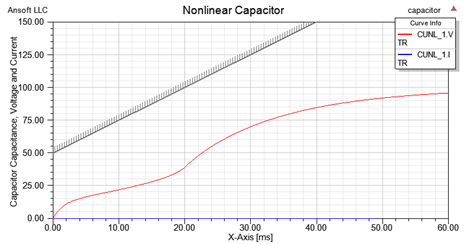
As shown in the following figure, if no curve violates a limit line, then the limit line hatching is restrained to 10 pixels in length. The minimal hatching keeps the focus on the curve traces rather than the limit lines.
Error Handling
If an error is encountered while calculating Limit Line Violations for a particular plot trace, the Curve Info window shows "NaN (<Limit Line name>)" under the Limit Line Violations column for that curve. For example, if a value is not available or goes to infinity at a particular point, the program is unable to evaluate that point. One of the coordinates is "Not-a-Number" (NaN).
