
Performing Worst Case Analysis
Two popular worst case analysis techniques can be implemented: extreme value analysis and Monte Carlo analysis.
Some setup is required before performing worst case analysis. First, identify uncertainties in design and create a local or project variable for each of them. Second, determine the variation range of each variable (Min and Max) - its statistical distribution is optional. Third, determine a measurement of performance, especially for extreme value analysis.
- Extreme value analysis:
This is one of the most popular methods to estimate worst-case performance. To start, a sensitivity analysis is performed. The results (sensitivities/first derivative) allow us to pick an extreme value (upper or lower bound) for each variable. The corresponding simulation result is used to predict upper and lower bound of performance. The assumption is that extreme performance is reached at boundary value (note that in certain cases, making such an assumption is not valid).
To perform an extreme value analysis in Ansys Electronics Desktop, create a new analysis under Optimetrics>Sensitivity.
- Setup:
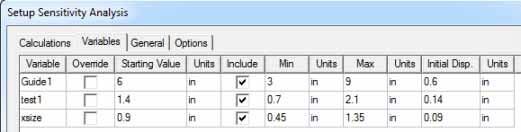
First, include variables in a sensitivity analysis. To do so, go to your list of variables, under Sensitivity, specify Min and Max values of each variable, and check 'Include'. The following figure shows an example with three variables included.
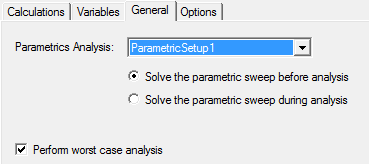
Second, follow Setting Up a Sensitivity Analysis in the help. During this procedure, set your performance measurement in Calculations tab; check all variables in Variables tab; check Perform worst case analysis in General tab.
Note:Checking Perform worst case analysis calculates 1st derivatives for each variable. If we have three variables and for Var1 first derivative is negative, Var2 1st derivative is positive, Var3 1st derivative is positive, then for Worst Case Analysis, we request two more variations:
Var1@minimum, Var2@maximum, Var3@maximun
and Var1@maximum, Var2@minimum, Var3@minimum
- After setup, analyze your Sensitivity Setup under Optimetrics.
- To view worst-case result (upper bound only):
Create a Data Table report.
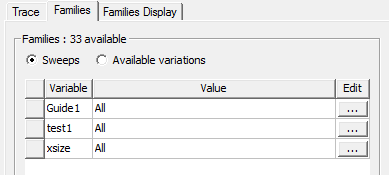
Note:Under the Context pane in the Report dialog box, select matching Solution and Optimetrics setup. Under the Families tab, change the setting to 'All' under 'Value' of each variables.
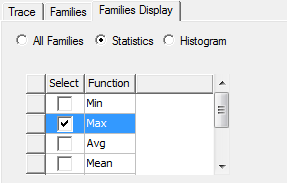
Under the Families Display tab, select Statisticsand then check Max.
The associated data table shows the Max values.
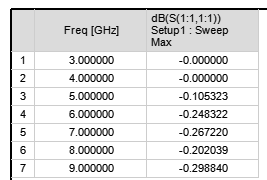
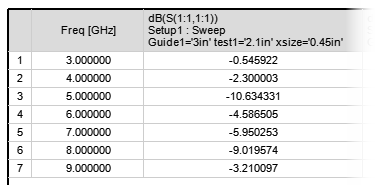
To see the corresponding variable values, select 'All Families' under the Families Display tab, and locate the max value to see value of variables.
 Tip:
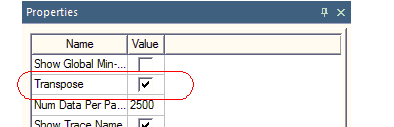
Tip:Transpose the table for an alternate view (double-click data table to view the Properties window, and on the Data Table tab check Transpose).
To estimate lower bound of performance:
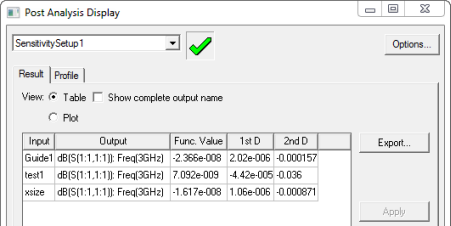
First, see the sensitivity of performance to the respect of each variable. (Follow the documentation for Viewing Output Parameter Results for a Sensitivity Analysis). Identify the variables that have major influence over performance.
Second, in your project, manually change these variables to the corresponding bounds: choose Min for positive 1st derivative and Max for negative 1st derivative.
- Setup:
- Monte Carlo analysis:
This method does not assume a circuit is linear - better accuracy is achieved with more iterations. The cost is computing time and resources.
To perform Monte Carlo Analysis in Ansys Electronics Desktop, create a new analysis under Optimetrics> Statistical. Follow the documentation on Statistical Analysis to set this up. The upper and lower bound of performance can be found on the edge of performance distribution.
Tip:If distribution of performance is not of interest, set all variables as uniformly distributed.