Prepare the Model for Large Scale DSO Analysis
Functionality featured in the example(s) in this section applies to multiple design types.
- Launch the desktop.
- Create the input project on the shared drive.
For this example, start with the standard HFSS OptimTee.aedt example and copy it to the shared drive.
Copy "<installation-directory>\<platform>Examples\RF_Microwave\OptimTee.aedt" to "\\sjo7na1\hfssprojs\OptimTee.aedt"
- set up the parametric table.
For this example, use the existing 'ParametricSetup1' as the parametric setup to solve.
- Prepare the outputs.
Outputs from Large Scale DSO come from pre-defined rectangular plots that are created before the Analysis command is issued. Follow the steps below:
- Because these DSO outputs come solely
from Rectangular Plots, delete all other postprocessing setups, and
then turn off Save Fields And Mesh as shown below.
Open ParametricSetup1 for editing. You will see that the OptimTee parametric setup contains three calculations, as shown below.
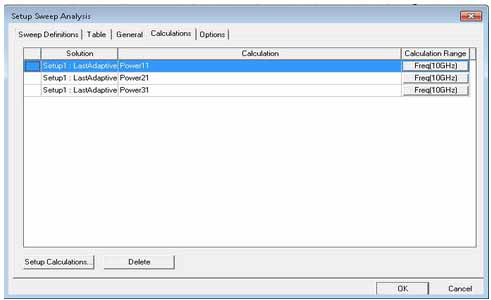
- Delete all three calculations. When you
have done so, the Setup Sweep Analysis Calculations tab looks like this:
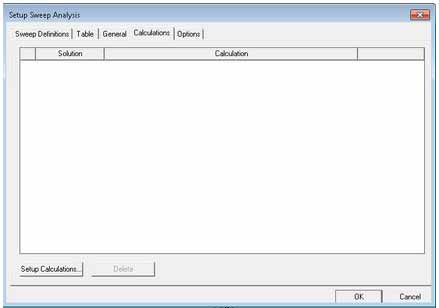
- Click on the Options tab and uncheck Save Fields And Mesh, as shown below:

- Because these DSO outputs come solely
from Rectangular Plots, delete all other postprocessing setups, and
then turn off Save Fields And Mesh as shown below.
- Use the Reporter to define outputs.
For this example, you add six traces that correspond to six csv outputs of the Large Scale DSO job: mag(S11), mag(S12), mag(S13), Power11, Power12, and Power13.
- As shown below, select three quantities: mag(S11), mag(S12), and mag(S13).
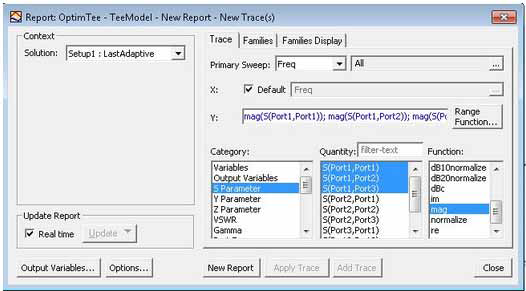
- Click on the Families tab and ensure that all variables
are set to Nominal, as shown below.
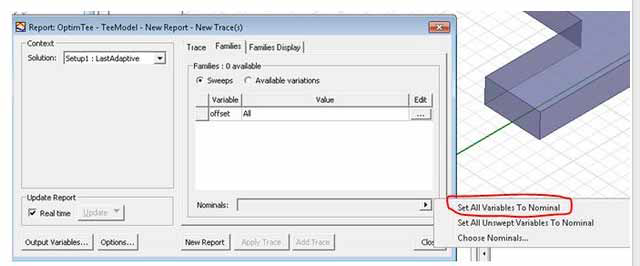 Note:
Note:For Large Scale DSO, outputs are not extracted correctly unless all variables on the Families tab are set to nominal.
- Click the New Report button.
Use the Report to create a Power distribution plot that has three power distribution traces.
- To create an S-parameter plot that has three traces, click Results> Create Modal Solution Data Report> Rectangular Plot.
- As shown below, select three quantities, Power11, Power21, and Power31.
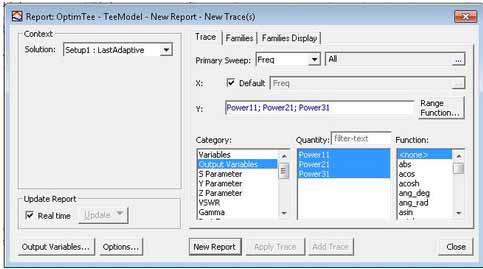
- Click on the Families tab and ensure that all variables are set to Nominal.
- Click the New Report button.
- As shown below, select three quantities: mag(S11), mag(S12), and mag(S13).
- Right-click the parametric sweep, and select Validate for Large Scale DSO.
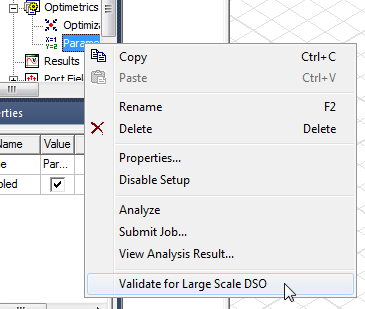
- A dialog reports any errors. These may occur if the steps just taken are neglected:
[error] Please remove all the calculations in Parametric Setup/Calculation page.
[error] Please turn off "Save Fields And Mesh" in Parametric Setup/Options page.
[error] No rectangular plot exist in the design. Please create a rectangular report.
- Correct any errors, if necessary to pass validation.
- Save and Close the project.
Next
