Mathematical Background: Spectra of Digital Signals
In the remainder of this note we derive the spectra of different digital signals of interest. These signals can be divided into two categories: the first is deterministic signals and the second is stochastic (random) signals.
Deterministic Signals
To characterize deterministic signals, we employ the Fourier transform. Let the input signal be x(t), typically measured in Volts. We seek the Fourier transform X ( jw), typically measured in Volts/Hz. This is given by
| 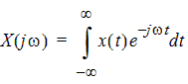 | (1) |
Here w=2pf is the angular frequency (radians/sec) and f is the frequency in Hz. Also,
j2 = -1. There is also an inverse Fourier transform defined by
| 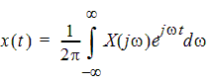 | (2) |
First let's consider a simple digital pulse with zero rise time. We will then extend the result to a pulse with finite rise and fall time, and then to the case of periodically repeating pulses.
Zero Rise Time Pulse
The input signal is held at the value 1 Volt for T seconds,
and is zero at all other times. It looks like this:
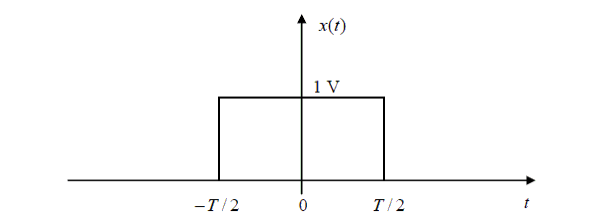
Fig. 10 A zero-rise time pulse
Applying the Fourier transform (1), we get
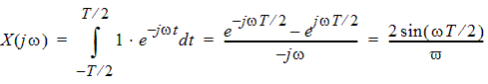 | (3) | |
Converting this to frequency units of Hertz yields
|  | (4) |
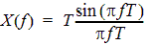
The Fourier transform for the zero-rise time signal looks like this:
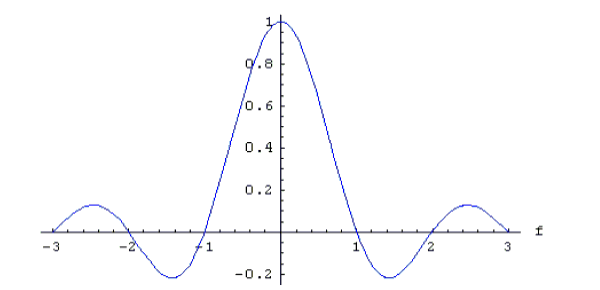
Fig. 11 Fourier transform of the zero-rise time pulse on a normalized scale
Notice that the maximum value of the function in (3) is T, attained at f = 0 . Evaluation of this function will require special care in the limit as fg0 to avoid dividing by zero.
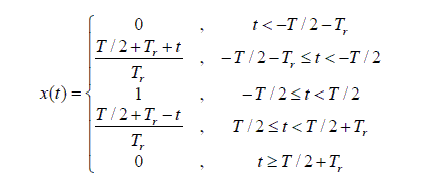
Finite Rise Time Pulse
In this case, the input signal has the appearance shown in the following figure. The maximum value is 1 Volt. The total width of the pulse is T + 2Tr.
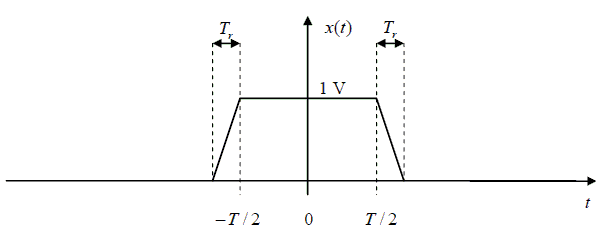
Fig. 12 A finite-rise time pulse
The waveform may be expressed analytically as
|
| (5) |
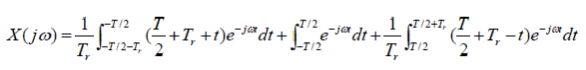
Now the Fourier transform becomes
|
| (6) | ||
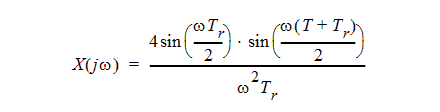
After some manipulation this can be simplified to
|
| (7) |
If we convert this to frequency in Hertz, we have
|
| (8) |
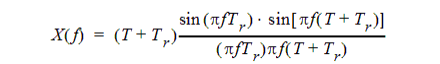
The maximum value of this function is T + Tr, approached in the low-frequency limit. A normalized plot of this frequency response for T = 0.6, Tr = 0.4 is given below:
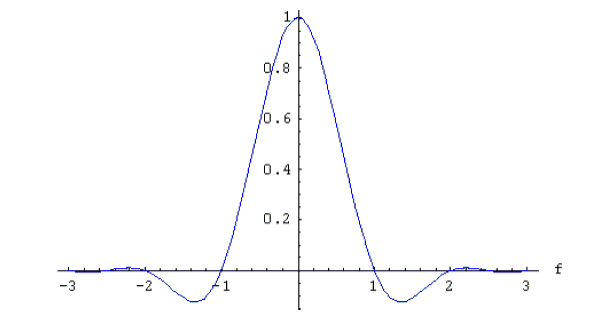
Fig. 13 Frequency response for a finite rise-time signal with T=0.6, Tr = 0.4
Notice that figures 11 and 13 look fairly similar. At higher frequencies, the amplitude of the frequency response falls off more quickly for the signal with finite rise time.
Periodically Repeating Pulse
Now we consider a digital pulse that repeats regularly with a period T0. This signal is shown in figure 14 below.
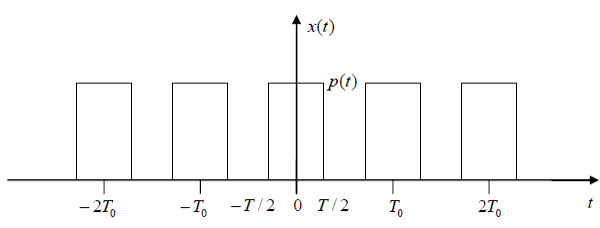
Fig. 14 Example of a periodically repeating
digital pulse.
In this example, the basic pulse shape is a zero-rise time pulse.
The basic pulse shape for a single period is given by
the function p(t), which is nonzero only for
-T0 / 2 <t<T0
/ 2. The complete periodic signal can be expressed as an infinite summation
of delayed pulses:
|
| (9) |

An alternative representation for a periodic signal is its Fourier series
|
| (10) |

Here w0 = 2p/T0 is the fundamental frequency of the periodic signal, and the complex Fourier series coefficients ak can be computed with the following integral:
|
| (11) |

The similarities of this integral to the Fourier transform in equation (1) are obvious. In the case of the Fourier series, the integral is carried out over a single period, while the Fourier transform integral in (1) is taken over all time. Another difference is that the Fourier series requires only the discrete set of frequencies kw0, whereas the Fourier transform integral deals with a continuous spectrum of frequencies from.

Another difference is the leading factor of 1/ T0 in the Fourier series integral. This leads to a coefficient ak with units of Volts, not Volts/Hz.
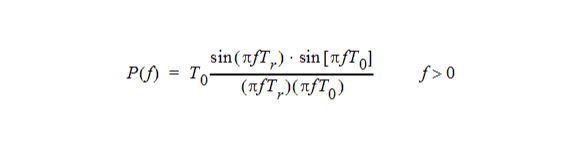
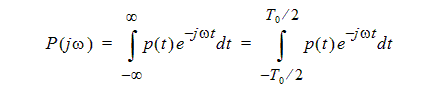
Let us compute the Fourier transform P(jw)of the basic pulse shape function p(t). Thanks to the time-limited nature of p(t), this is:
|
| (12) |
Comparing with equation (11), we see that
| 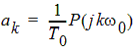 | (13) |
Thus we can rewrite the Fourier series (10) for the periodic signal as
| 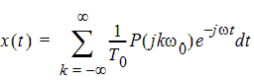 | (14) |
It is easy to show (by using the inverse Fourier transform
in (2)) that the Fourier transform of the complex exponential signal  is a Dirac delta function, 2pd(w-kw0.
Using this fact, we can now find the Fourier transform of the
repeating pulse signal in (14):
is a Dirac delta function, 2pd(w-kw0.
Using this fact, we can now find the Fourier transform of the
repeating pulse signal in (14):
|
| (15) | ||
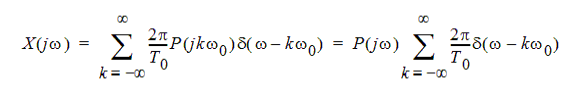
If we convert this to frequency in Hertz, we get
|
| (16) |

Here f0=1/T0 is the fundamental frequency in Hz.
Thus we have shown that the Fourier transform of a repeating pulse is an infinite series of delta functions, scaled by 1/T0 times the Fourier transform of the basic pulse shape. Such a signal is impossible to plot, because the delta function is an infinitely high, infinitely narrow spike. It is, however, possible to plot the closely related Fourier series coefficients. For a zero-rise time pulse with T = 1 and a period T0 = 4 we get the following plot:
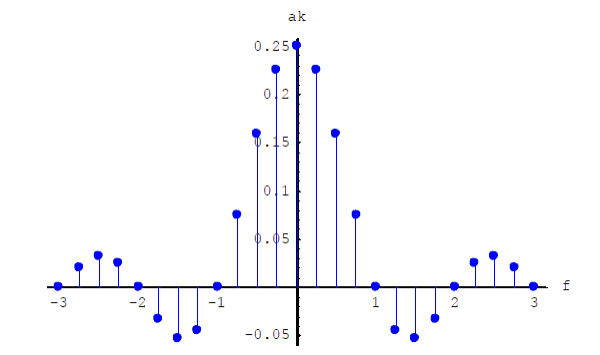
Fig. 15 The Fourier coefficients for a periodic
repeating zero-rise time pulse
Compare this with figure 11 for a single pulse.
Special case: clock pulse with T0=Tclock=1/fclock and T+Tr=T0/2
In this case we have from (16)

and we substitute from (8)

This gives

The first term on the right-hand side, 1/2d( f) , is the DC term which comes from k=0.
Indeed, in this case the average value of the signal is ½.
In the summation, by combining the positive and negative values of k, we implicitly limited the observations to positive frequencies and inserted a factor of two. See the practical note later in this document.
The product sin(pfTclock / 2) d(f -kfclock) is zero for even values of k and is +d(f - kfclock) for odd values of k. We therefore find
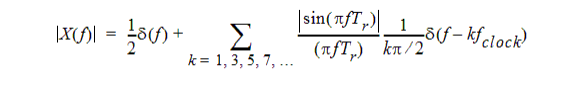
The unit is V/Hz if the clock signal is a voltage. Thus, the spectrum consists of a DC term of 0.5 V plus AC terms of

at frequencies f=kfclock, k=1,3,5,7,…
If the rise time is zero, the sinc function is one and we simply have AC terms of at frequencies f=kfclock, k=1,3,5,7,… This is confirmed by Eric Bogatin in [1].
[1] Eric Bogatin, Signal Integrity - Simplified, ISBN 0-13-066946-6, published by Prentice Hall, Chapter 2: Time and Frequency Domains.
Using the Envelope Function for Radiated Field Computations
In any single-input linear time-invariant system, the Fourier transform Y(jw) of the output is related to that of the input signal by a transfer function H(jw):
| 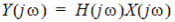 | (17) |
If there are N inputs, with Fourier transforms X1(jw), X2(jw),...XN(jw), output is characterized by N different transfer functions:
|
| (18) |

The input signals in an HFSS project are typically incident modal waves or terminal voltages. The output signals could be reflected waves (if we are dealing with S-parameters) or the vector components of near or far electromagnetic fields. HFSS computes the transfer functions from the inputs to the outputs of interest.
The Edit Sources function in the fields postprocessor takes care of forming the following linear combination:
|
| (19) |

where the Ck are complex-valued constants (specified by their magnitude and phase.)
If all of the input signals are deterministic digital signals with the same shape (aside from a constant scaling factor Ck), then we can write Xk(jw)=CkX0(jw) where X0(jw) is the Fourier transform of the common signal shape. In this case, equation (18) reduces to
|
| (20) |

Therefore we can simply multiply the Edit Sources result in equation (19) by the Fourier transform X0(jw) of the (common) digital signal shape. If, at some future point, we want to consider inputs that carry different digital signals, then modifications would be needed to Edit Sources to implement equation (18) in its full generality.
If we are dealing only with the magnitude of the response Y(jw), then we have
|
| (21) |

A Note about the Signal Scale Factors
Strictly speaking, only real-valued (positive or negative) signal scale factors Ck should be allowed when we are dealing with digital signals. If an arbitrary complex number is used, then the resulting scaled time-domain signal will not be real-valued. This is non- physical.
It would be more reasonable to interpret the phase as being the phase lag (modulo 2p) at a certain frequency; then an equivalent delay Td could be computed. This could be used to compute a frequency dependent scale factor exp(-jwTd) for the input signal.
A Practical Note about Measurement Equipment
Most frequency domain measurement equipment (spectrum analyzers and vector network analyzers) will display signal amplitude, not the Fourier transform amplitude. If the input signal is a cosine function with amplitude 1, its Fourier transform is
|
| (22) | ||
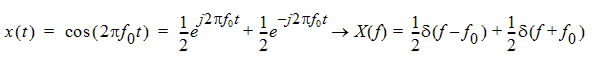
This would suggest that a spike of amplitude ½ should appear at the frequency f0. Most measurement equipment is calibrated with exactly this sort of reference signal, but usually the persons performing the calibration adjust the equipment to display a value of 1 as the output. Therefore, if one wishes to duplicate what is shown on the measurement equipment, the Fourier transform of the output signal should be multiplied by a factor of 2.
Stochastic Signals: Random Bit Streams
Now we consider random bit streams. The signal is a continuous function of time, and consists of pulses with a fixed basic pulse shape p(t). Each delayed pulse is modulated by a random variable xn. We represent the complete random bit stream as
|
| (23) |

For a digital random process, the discrete random variables xn can take on only two distinct real values, representing a logic 1 or 0. We make some assumptions about the statistics of these discrete random variables. First, we assume that the mean (expected) value of xn is independent of time:
| 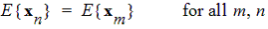 | (24) |
Here E(.) denotes the expected value of a random variable. Secondly, we assume that the discrete autocorrelation function of the bit values E{xmxn} depends only on the time difference m-n, and not upon the absolute values of m and n :
| 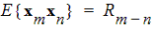 | (25) |
To use the formal language of random processes, we are assuming that the discrete random sequence {xn} is wide-sense stationary.
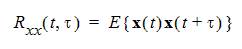
For a real-valued random process x(t) that is a function of a continuous time variable t, we define the autocorrelation function Rxx (t, t) as
|
| (26) |
In this note, we are dealing with random processes of the form shown in equation (23). Such a process is cyclostationary. In this case, the autocorrelation is a periodic function of time:
| 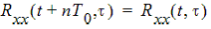 | (27) |
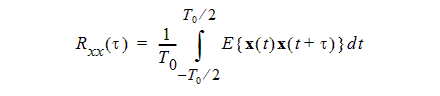
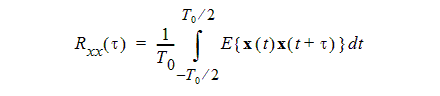
For a cyclostationary signal, we can introduce a time-averaged autocorrelation, where the time averaging is over a single period. In this case the autocorrelation depends only upon the time shift t:
|
| (28) |
The power spectral density (or PSD) of a random process is the Fourier transform of its autocorrelation function:
|
| (29) |

Typically we use the power spectral density to characterize random processes in the frequency domain.
Deterministic Signals with Finite Energy
The autocorrelation and PSD are also defined for deterministic signals, but the definition of the autocorrelation is somewhat different. For a real-valued deterministic signal x(t) with finite energy (i.e., non-periodic), we define the autocorrelation as
|
| (30) |

The PSD is still defined as the Fourier transform of the autocorrelation. We can show that the PSD is the magnitude squared of the Fourier transform X j of the
deterministic signal:
| 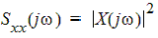 | (31) |
Deterministic Periodic Signals
For a deterministic signal that is periodic and real-valued, the autocorrelation is defined
using an integral over a single period:
|
| (32) |

(Notice the similarity to equation (28), which applies to cyclostationary random signals.) If x(t) has the Fourier series coefficients ak, then we can show that its autocorrelation function is also periodic, and has a Fourier series with the coefficients |ak|2.
Here again the PSD is the Fourier transform of the autocorrelation. Because the autocorrelation is periodic, the PSD is a set of impulses in frequency:
|
| (33) |

or in units of Hz,
| 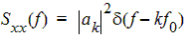 | (34) |
Finding the Power Spectrum of a Random Bit Stream
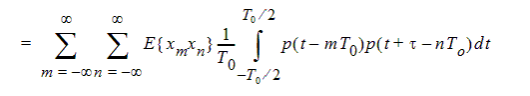
We are now ready to attempt to find the power spectral density (PSD) of the random bit stream in equation (23). The procedure will be to compute its autocorrelation Rxx(t) using equation (28), and then to take the Fourier transform of this to get the PSD.
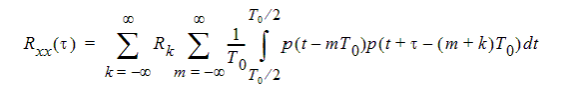
Substituting (23) into (28), we find that the autocorrelation is
|
| (35) | ||
|
|
| ||
|
|
| ||
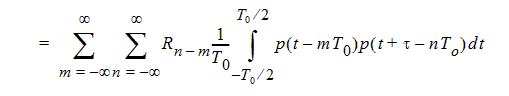
Here again we are using Rk = E{xnxn+k to denote the autocorrelation of the discrete random bit values xn . Now let us define k = n - m and eliminate n from the above expression. We rewrite the summation as
|
| (36) | ||
|
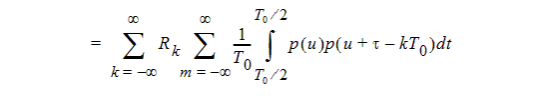
where we have introduced u = t -mT0. Notice now that the integrals being summed up over non-overlapping intervals of length T0, when taken together, actually constitute a single integral over the entire time axis. Thus we can write
|
| (37) |
|
|
|
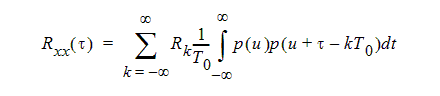

where Rpp(t) is the autocorrelation of the basic pulse shape p(t):
|
| (38) |

To get the PSD of the random bit stream, we now need to take the Fourier transform of the autocorrelation in (37). Making use of standard Fourier transform properties, this is
|
| (39) |
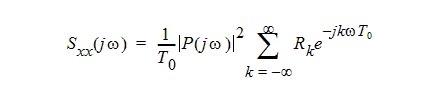
Here P(jw) is the Fourier transform of the basic pulse shape; thus |P(jw)|2 is the PSD of the basic pulse.
The power spectrum expression in (39) is fairly general. We can now consider some important special cases.
A Random Bit Stream with Bipolar Modulation
In this case, the random variables xn take on the values +1 or -1 with equal probability (1/2), and we assume that the values of any two different bits are independent of one another. The signal is illustrated below in figure 16.
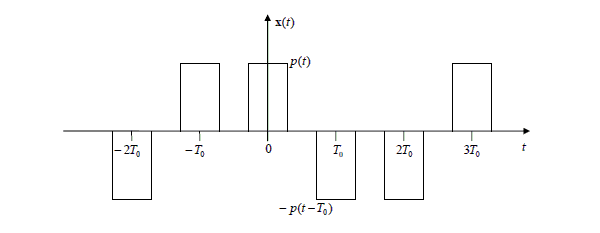
Fig. 16 A sample
of an ideal random digital bit stream with bipolar modulation It is
modulated by a sequence of random variables that assume the values
+1 or -1 in each interval.
Thanks to the assumed statistics, we have
|
| (40) |

Therefore (39) immediately simplifies to
| 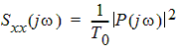 | (41) |
This derivation does not depend upon the particular pulse shape p(t). Therefore it applies equally well to zero rise time pulses and to finite rise time pulses. An illustration for a zero-rise time pulse (T = 1) and a pulse period T0 = 4 is shown below in figure 17:
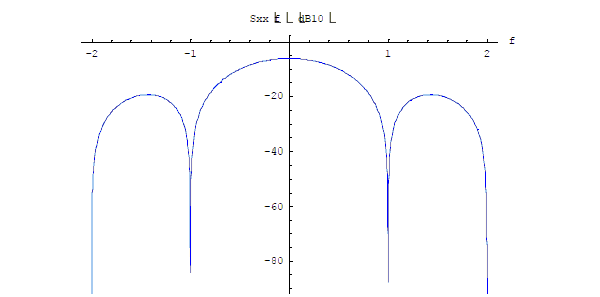
Fig. 17 Power
spectral density for a random bit stream with bipolar
modulation and a pulse shape corresponding to a zero rise time
pulse.
A logarithmic dB10 scale has been used for clarity.
Special case with bipolar modulation
Let's consider the special case where T+2Tr=T0. This means that the signal x(t) in figure 16 never stays at zero for any length of time. From (41) we have

and from (8) we have

This leads to

For zero rise time, this equation simplifies considerably:

The field- or voltage based spectral density is simply given by (8)

which for zero rise time simplifies to

To see that P(f) indeed accounts correctly for the field- or voltage based spectral density, consider the following situation. The signal x(t) is a voltage that is applied to a one-Ohm resistor. If we have a sequence of N bits, -1V or 1V, with zero rise time, and with a total duration of NT seconds, how much energy would this signal dissipate in the 1-W resistor?
The energy deposited in the resistor will be
(VI in the frequency domain) × number_of_bits.
Both V and I will now be given by P(f), one being in V/Hz and the other in A/Hz.

This results in a power dissipation (energy/time = energy/(NT)) of

in which we recognize the expression for Sxx(f).
At this stage, both positive and negative frequencies are allowed. Because of the practical note elsewhere in this document we can limit ourselves to positive frequencies, add a factor of two, and state that the voltage- or field based spectral density is given by

A Random Bit Stream with Unipolar Modulation
Now we will consider the case where the modulating random process xn takes on the values +1 or 0 (with equal probability of 1/2) in each interval. We refer to this as unipolar modulation. The signal is illustrated below:
Fig. 18 Random bit stream with unipolar modulation
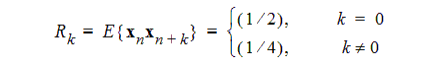
Again we assume that the values of two different bits are independent. Here the autocorrelation function values are different. For m = n, the two possible values of xmxn are 1 and 0, and each occurs with probability ½. For mm n, the possible values of xmxn are also 1 and 0, but because the two random variables are independent, a value of 1 occurs only ¼ of the time. Thus we have
|
| (42) |
Inserting this into (39) gives
|
| (43) |
|
|
|
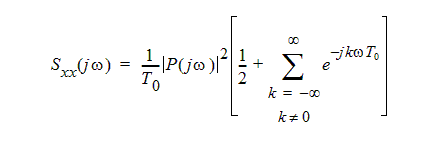
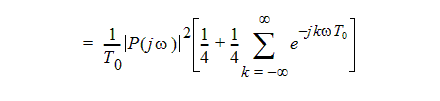
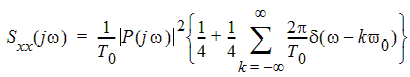
The infinite sum can be recognized as a Fourier series with the coefficients ak =1. Thus it represents a periodic signal. As we show in the appendix, the signal with this particular set of Fourier series coefficients is an infinite train of impulses. Replacing the Fourier series with the periodic impulse train, we obtain
|
| (44) |
If we prefer to work in frequency units of Hz, this becomes
|
| (45) |
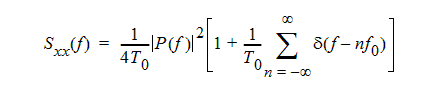
Once again, the derivation applies to any pulse shape, with zero or finite rise time. The above result for a unipolar bit stream is distinctly different from the result for a bipolar stream, thanks to the train of impulses represented by the second term. The power spectrum contains a continuous part, exactly ¼ as large as the spectrum of a bipolar signal, plus a set of narrow spikes at discrete frequencies (multiples of 1/ T0). It can be shown that one half of the total signal power is in the discrete part of the spectrum, and one half is in the continuous part.
Obtaining a plot of this function is difficult, because it contains both infinite impulses and a finite continuous part. If we assume that the frequency response is run through a detector with finite frequency sensitivity Df, then the apparent amplitude of the spikes will be finite and scaled by the factor 1/Df. The amplitude of the continuous part of the spectrum will be almost unaffected. Taking, for example, T0 = 4, a zero rise time pulse shape with T = 1, and Df =10-4, we arrive at the following plot:
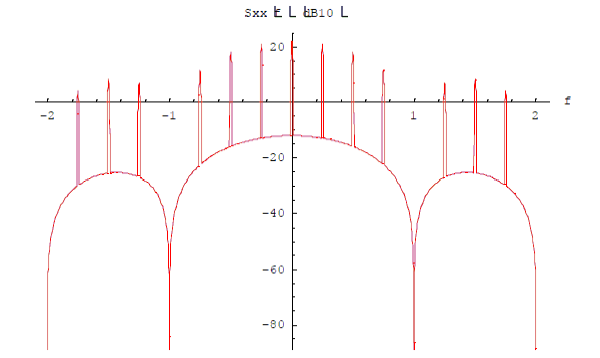
Fig. 19 Power spectrum for the random bit
stream with unipolar modulation,
showing the periodic spikes. A dB10 logarithmic scale has been
used for clarity.
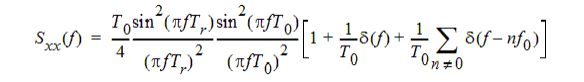
Special case with unipolar modulation
Let's consider the special case where T+Tr=T0. This means that the random signal spends equal amounts of time at level zero and at level one. We repeat (45) for convenience:

In this equation P(f) is given by (8)

which can now be written as

This leads to
Note that, for nm0,

so the summation with delta functions over nonzero values of n disappears. What remains is

This can be recognized as a DC term of 0.25 W plus a spectrum for all nonzero frequencies. The DC term of 0.25 W makes sense since the average value of the signal x(t) is 0.5 V in this case.
The field- or voltage based spectral density is simply given by (8)

which for zero rise time simplifies to

To see that P(f) indeed accounts correctly for the field- or voltage based spectral density, consider the following situation. The signal x(t) is a voltage that is applied to a one-Ohm resistor. If we have a sequence of N bits, 0V or 1V, with zero rise time, and with a total duration of NT seconds, how much energy would this signal dissipate in a 1-W resistor?
We can expect a DC level of 0.5V with a DC current of 0.5A, plus bits with the given spectrum for an additional voltage swing of ±0.5V with a corresponding additional current of ±0.5A. If there are N bits for a total duration of the stream of NT seconds, the energy deposited in the resistor will be
DCterm × time + ACterm × number_of_bits

This results in a power dissipation (energy/time = energy/(NT)) of 0.25 W for the DC term plus a power dissipation of

to account for the pseudo-random voltage swing of ±0.5 V around the DC level. Here, we recognize the result we had earlier.
This expression corresponds to the expression given for power spectral density by Clayton Paul [2].
[2] Clayton R. Paul, "Introduction to Electromagnetic Compatibility", ISBN 0-471- 54927-4, published by John Wiley and Sons, 1992, section 7.6: Signal Spectra, Representation of Random Signals.
Finally, because of the practical observation elsewhere in this note, we can limit ourselves to non-negative frequencies and include a factor of two: