Apply Receiver Jitter and Noise Controls Simultaneously (2D and Circuit)
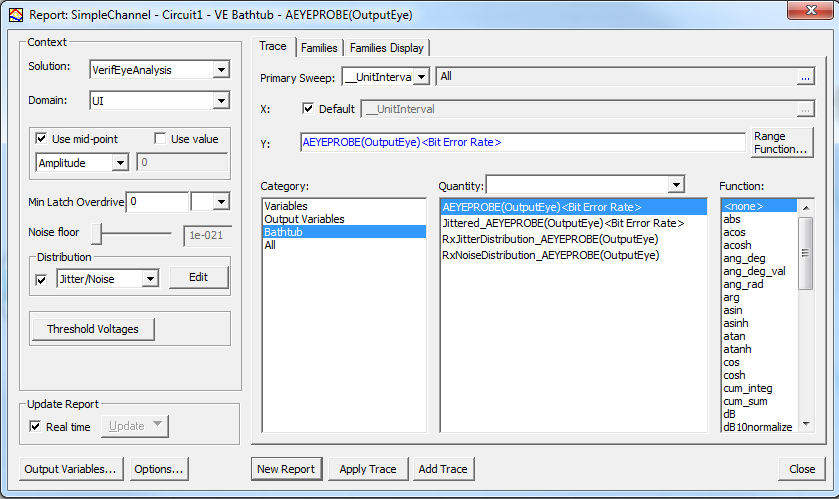
You can apply distributions of receiver jitter (variation in timing) and noise (variation in voltage) to the simulated data, using the controls in the Distribution group box of the reporter window. To view the added jitter or noise distribution, a VerifEye, QuickEye, or AMI bathtub plot is used. For AMI, the Distribution group box is available with the "Eye After Probe" quantity.

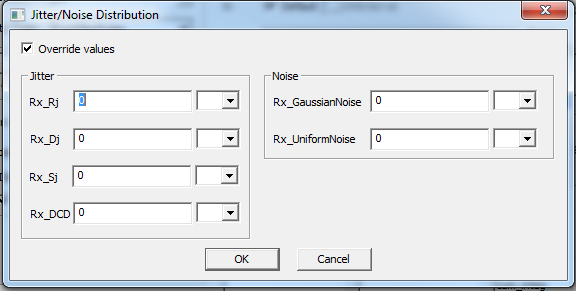
- Click the check box in the Distribution group box and select Jitter/Noise on the drop-down menu. Then click Edit to open the Jitter/Noise Distribution window.

- Add a Gaussian Jitter distribution in the Rx_Rj field, giving the standard deviation. Specify the time units.
- Add a Uniform Jitter distribution in the Rx_Dj field, giving the half-width of the distribution in time, and specify the time units.
-
Add a sinusoidal jitter (Rx_Sj), giving the amplitude of the distribution in time units.
- Add a clock duty cycle distortion (Rx_DCD), giving one-half the peak-to-peak variation of the distortion in time units.
- Add a Gaussian Noise distribution in the Rx_GaussianNoise field, giving the standard deviation, and set the voltage units.
- Add a Uniform Noise distribution in the Rx_UniformNoise field, giving the half-width of the distribution, and specify the voltage units.
- Click OK to close the window.
The parameter names and definitions are as defined in the IBIS specification. See AMI Receive Jitter Parameters .
When Jitter/Noise has been enabled, four quantities are available for plotting: the bathtub with no jitter (AEYEPROBE(OutputEye)<Bit Error Rate>), the bathtub with the jitter and noise applied (Jittered_AEYEPROBE(OutputEye), the distribution of the jitter (RxJitterDistribution_AEYEPROBE(OutputEye), and the distribution of the noise (RxNoiseDistribution_AEYEPROBE(OutputEye).

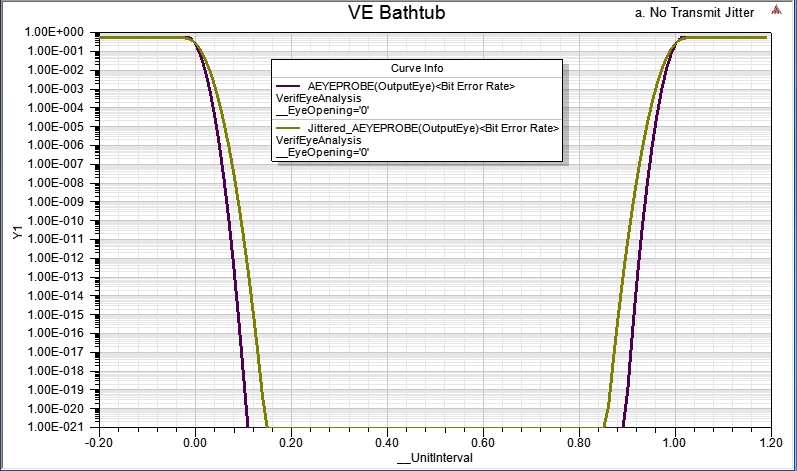
The Bathtub plot shows some example results:

The AEYEPROBE(OutputEye) trace shows the BER curve before the jitter is applied (UI=1ns). The Jittered_AEYEPROBE(OutputEye) trace shows the BER curve after a random receive jitter (Rx_Rj) with standard deviation 100ps is applied.
