
Drawing a 3D Line Segment
The following describes how to draw an object with one or more straight segments.
- Create the 3D Line: To draw the line, on the Draw menu, select Primitive > 3D Line. Once you have completed the line, its associated property window should appear similar to the following example.
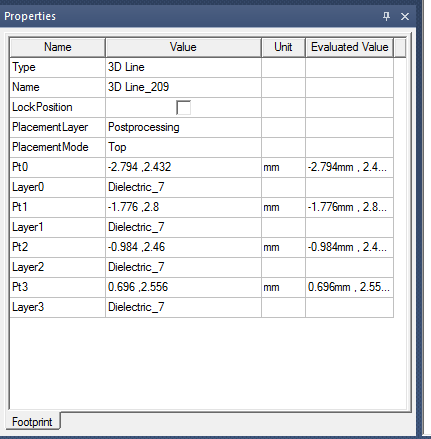
The property window for the line has following features: — Placement Layer: The layer on which this primitive exists. It is always set to ‘Post-processing’ and cannot be changed. — Each point has its 2D coordinates and a layer on which it is placed currently. — The layer for each point is initially set to the active Layer in the ‘Active Layer’ drop-down menu. — PlacementMode: Can be set to Top, Bottom, Middle, or 3D. It is initially set to Top.
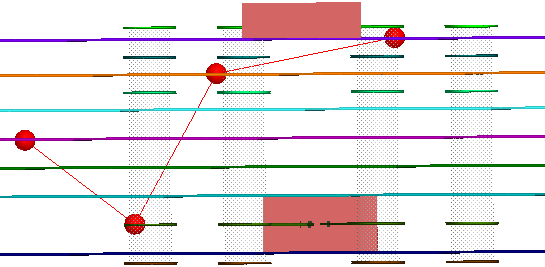
- Select the Layers for Each Point: The field named layer contains a list of all the stackup layers present in the design. The point can be placed on any of those lines. Each layer has a different elevation and changing the layer for each point has the effect shown in the following image.
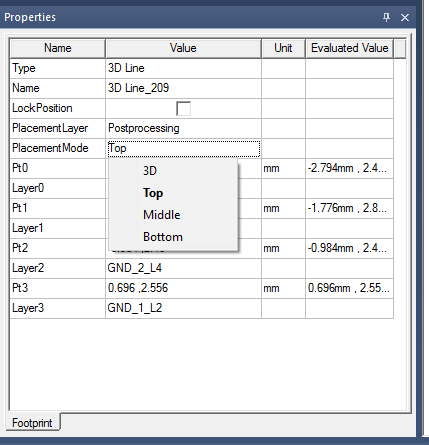
- Toggle between placement modes:
- Top: Places the point on the ‘Upper elevation’ of the current layer.
- Bottom: Places the point on the ‘Lower elevation’ of the current layer.
- Middle: Places the point on the middle elevation (lower elevation + thickness/2) of the current layer.
- 3D: The point has true 3D coordinates which can be changed as chosen.
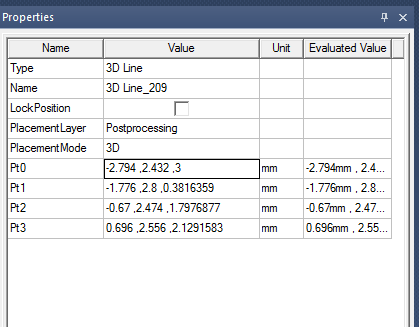
- Changing from Top to 3D: The property window shows the layer names have been removed and the ‘Pt’ field contains the true 3D coordinates of the point. The 3D coordinates of the point are currently set to the upper elevation of the layer, since you have toggled from Top to 3D.
- You can change the coordinates of the point using the property window, as shown in the following image. Note the difference in the Z-coordinate for Pt0.
- In 3D mode, while toggling back to top/bottom/middle, the layer for each point is set to the layer whose elevation is closest to the point. The point is then moved to that layer.
- Toggling from 3D to Middle/Bottom or the reverse yields similar results and assigns layers to the points based on the Middle/Lower elevation.
4. Script Recording and Replay:
- 3D Line script record/replay works just like any other script record/replay. Before drawing the line, click on Tools > Record Script to Project. Once you have finished drawing the line, click on Tools > Stop Recording.
- From the project manager window, go to Definition >Scripts. Right-click the script to see the available operations.
- The recorded script looks like the following diagram. Running the script returns the geometry of the line captured in the script.

5. Analyzing the Results and Plots:
-
Create an HFSS Setup, then analyze.
- Draw a 3D line by clicking on the icon in the ribbon.
-
From the property window, change the placement mode to 3D. From the toolbar, change the moving axis to Z. Then change the coordinates of some points in the line.
-
Select Results > Create Fields Report > Rectangular plot and ensure all the settings are the same as in the following diagram that shows the settings in the Trace and Families tabs.
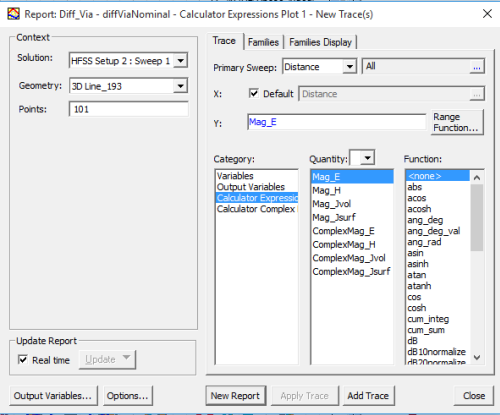
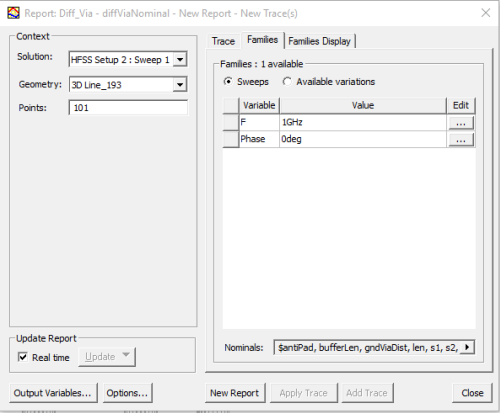
The resulting plot is shown in the following image.
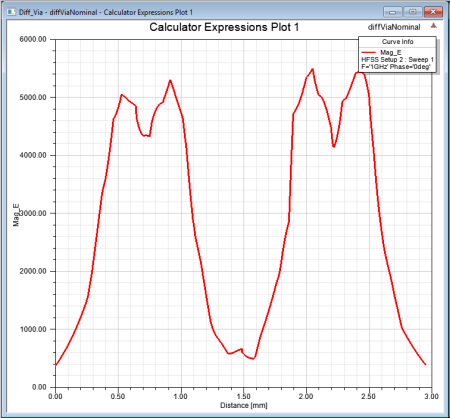 Now return to the Layout Editor and move the line to a new position. Observe the plot should change accordingly.
In a similar manner to these examples shown, other types of plots can be obtained by right-clicking on Results in the Project Manager window and choosing on the Create Standard Report drop-down menu.
For more information, refer to the plotting and report information listed in Post Processing and Generating Reports and Post Processing and Generating Reports for 2D and Circuit.