AMI Analysis in HFSS 3D Layout
From the Schematic Editor, perform these steps to set up, run, and view the results of an AMI analysis in HFSS 3D Layout. For additional information, see AMI Analysis.
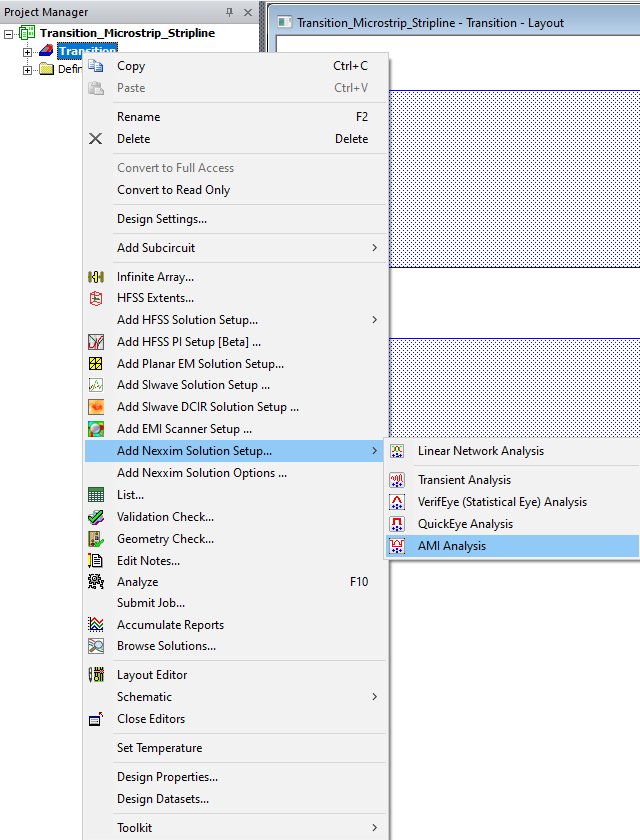
- From the Project Manager window, expand the Project Tree and right-click [Active Design Folder]. Then select Add Nexxim Solution Setup > AMI Analysis to open the AMI Analysis window.

Alternatively, on the Project Manager window, expand the Project Tree and [Active Design Folder]. Then right-click Analysis and select Add Nexxim Solution Setup > AMI Analysis.

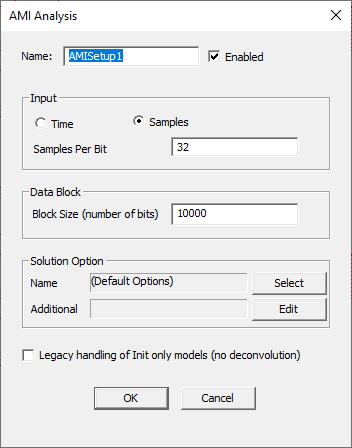
- Ensure the Enabled box is checked (default setting).
- AMI simulation uses a fixed timestep for sampling the impulse response and any processed waveforms. From the Input area, choose Time or Samples to define the unit interval (UI) at which the impulse response and waveforms are sampled.
- Samples allows you to specify the number of samples per bit (default is 32 samples per bit). Most AMI models and simulations are set up using Samples per bit.
- Time allows you to set the absolute timestep in seconds. The timestep must be greater than 0, and must be a fraction of the UI. The default timestep is 5e-10 seconds.
- The Block Size (number of bits) field sets the number of bits per AMI data block (default is 10,000 bits per block).
- Optionally, use the fields in the Solution Option area to add AMI options.
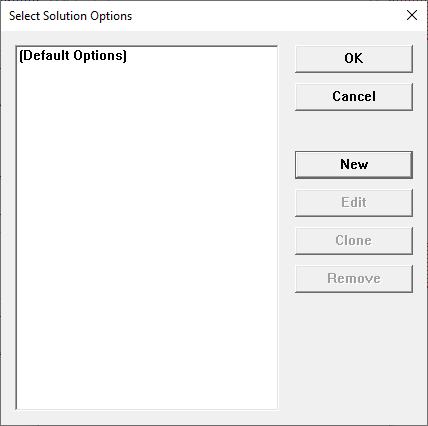
- Click Select to open the Select Solution Options window.

- To create a new option set, click New to open the Solution Options window.

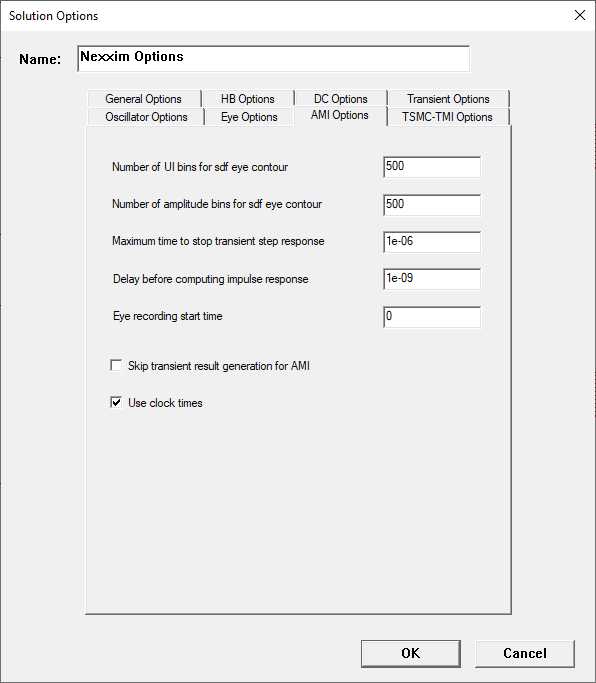
- Enter a for the new option set in the Name field.
- Choose on the fields and check boxes in the AMI Options to set options, as appropriate.
Alternatively, open the Solution Options window on the Project Manager. Either expand the Project Tree and right-click [Active Design Folder], or expand [Active Design Folder] and right-click Analysis. Then select Add Nexxim Solution Options .
|
Option |
Default Value |
Description |
|
ami.ampl_bins |
500 |
Number of histogram bins to use for generating the 3D and contour data. |
|
ami.delay |
1 |
Delay before computing impulse response. |
|
ami.eye_start_time |
0 |
Start time for recording eye data. |
| ami.resp_tmax | 1e-6 | Maximum time for the transient impulse response calculation. |
| ami.skip_tran_result | 0 |
0=Save transient data for AMI 1=Skip transient result generation for AMI (useful for long runs of data that need not be saved). |
| ami.ui_bins | 500 | Number of histogram bins to use for generating the 3D and contour data. |
| ami.use_clock_times | 1 |
1=Turn on sampling of the eye diagram based on the clock time values produced by the AMI receiver model. 0=Do not use clock times on the AMI receiver. The eye diagram are sampled at even UI intervals. The results of clock time sampling can be observed only in the Statistical Eye Plot for the "EyeAfterProbe" quantity. |
