
Using the Smith Tool Utility
To access the Smith Tool utility, perform the following steps:
- Double-click Smith Chart 1 under Results to make the plot active.
This action updates the menu bar with the Report2D item.
Selecting plot under Smith Chart
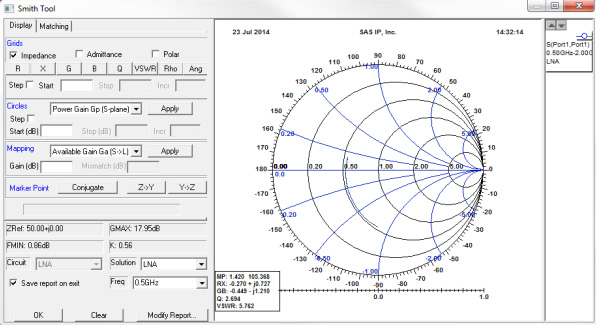
- From the menu bar, go to Report2D > Smith Tool to open the Smith Tool window.
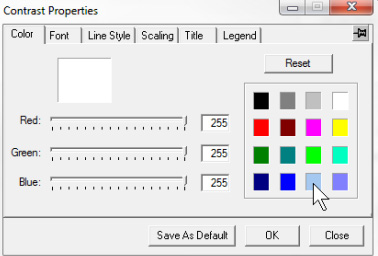
Note: Double-click
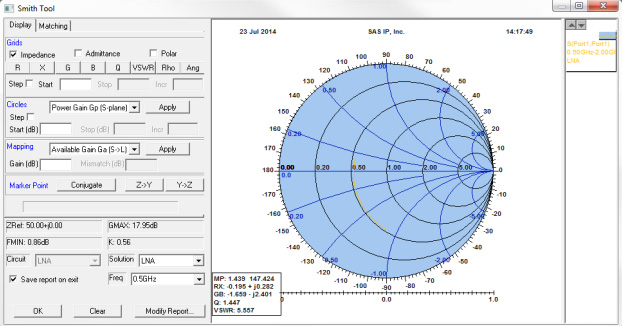
inside the Smith Chart circle to open the Contrast Properties
window and select the appropriate color. Change other properties
as needed.
The Smith Tool Utility contains several areas as follows:
- In the Grids area, draw constant R, X, G, B, Q, VSWR, and Rho circles on the plot.
- In the Circles area, draw Gain, Noise, and Stability circles.
- In the Mapping area, transform the responses on the source plane to the load plane and vice-versa.
- At the top of the window, there are tabs to switch between the Display portion of the window and the Matching portion.
- At the bottom of the window is information that is calculated on the device S Parameters:
- Maximum Stable Gain
- Minimum NF
- Stability factor