
Transient Analysis Outputs
The graphical plots and reports described in this topic help you to visualize the relationship between design parameters and transient analysis results.
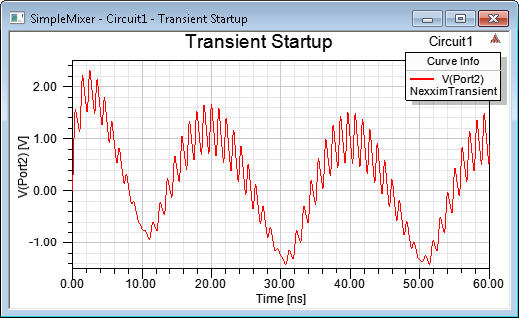
- To view the Transient results in the Time domain, click on the Results icon and select Create Standard Report>Rectangular Plot.
- Selections in the report window are context-sensitive. Whatever Eye Probe/Scope settings are chosen determines the relevant output quantities from which you may select.
Select Transient analysis as the Solution, Time as the Domain, Voltage as the Category, a port or net voltage as the Quantity, and <none> as the Function. - Click New Report to generate the plot.
For details on creating and modifying reports, see Generating Reports and Post-processing.