
Importing Tabular Solution Data
To import solution data in tabular format, select Tabular Data on the Import Solution window. (To specify the imported file should be read at analysis time rather than copied into the project, also click Link to file). Then click OK to open the Data Table Import window.
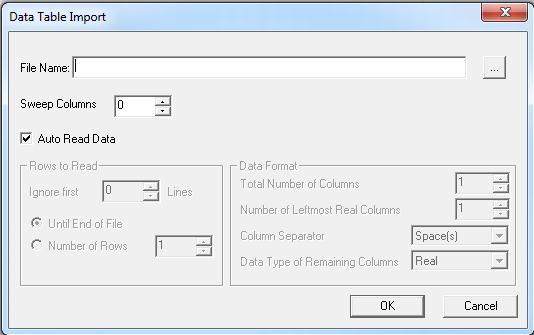
Enter the name of the tabular data file in the File Name window, or click the [...] button to look for the file. When you have entered all appropriate information into the Data Table Import window, click OK to import the data.
With Auto Read Data Selected
When Auto Read Data is selected, Electronics Desktop attempts to read the data in automatically, based on the following assumptions regarding the format of the tabular data:
- Rows that begin with a hash (#), star (*), exclamation point (!), or any non-number is ignored.
- Each comma, space, and tab is treated as a column separator.
- Numbers followed by an “i” or “I” are treated as complex values.
- The first column is always regarded as X data.
- All columns but the first are always regarded as Y data.
- Empty columns are zero filled.
With Auto Read Data Unselected
When Auto Read Data is not selected, the Rows to Read and Data Format subsections offer the following options:
- Ignore first specifies the number of rows of data at the head of the file to ignore
- Until End of File specifies that all rows of data is to be read
- Number of Rows specifies the number of rows to be read
- Total Number of Columns specifies the full number of columns of data
- Number of Leftmost Real Columns specifies the number of leftmost columns of real data
- Column Separator specifies the column separator: Space(s), Tab, Comma, or Period
- Data Type of Remaining Columns specifies the data type for the columns not included in the Number of Leftmost Real Columns:
|
Real |
Real numbers |
|
re/im |
Complex numbers in real/imaginary format |
|
mag/ang(deg) |
Complex numbers in magnitude/angle format with angles in degrees |
|
mag/ang(rad) |
Complex numbers in magnitude/angle format with angles in radians |
Sweep Columns
This option allows you to specify the number of leftmost columns in the imported file that can be treated as sweep data rather than quantity data. When Sweep Columns is non-zero, an implicit sweep is created automatically as the file is read. For example, with Sweep Columns set to 2, the following imported data could be used to create the 3D Rectangular Plot shown in the following figure:
1 1 -11.9494901844939
1 2 -1.02976604277775
1 3 -65.0043850531982
1 4 -66.1547663779434
1 5 -76.5001257180356
1 6 -77.0620478855849
1 7 -78.7052860174241
1 8 -71.4292118632088
1 9 -59.271550467952
1 10 -73.4397348975777
2 1 -1.02976604277775
2 2 -13.7362474109939
2 3 -64.4351612784164
2 4 -63.9486697204035
2 5 -75.69071743575
2 6 -74.7859772914394

From the imported file, the line immediately preceding the start of numerical data is checked for column names. If this line contains the chosen number of entries, these entries are then used as column-data annotations in the generated plot, as shown in the following example.
Xdata Ydata Zdata
1 1 -11.9494901844939
1 2 -1.02976604277775
1 3 -65.0043850531982
1 4 -66.1547663779434
1 5 -76.5001257180356
1 6 -77.0620478855849
1 7 -78.7052860174241
1 8 -71.4292118632088
1 9 -59.271550467952
1 10 -73.4397348975777
2 1 -1.02976604277775
2 2 -13.7362474109939
2 3 -64.4351612784164
Each column name (Xdata, Ydata, Zdata) is appended with the string “import” before being added to the plot.
