Fatigue analysis is usually performed to assess the safe life of such a part using the stress/strain-life (SN/EN) methods. The following series of steps is generally performed.
Complex loading is reduced to a series of simple cyclic loadings using a technique such as rainflow analysis.
A histogram of cyclic stress is created from the rainflow analysis to form a fatigue damage spectrum.
For each stress level, the degree of cumulative damage is calculated from the S-N curve.
The effect of the individual contributions is combined using an algorithm such as Miner's rule.
Stress-life (SN) method and strain-life (EN) method are both available in the Motion postprocessor fatigue analysis and fatigue life can be evaluated in three ways as a material property type.
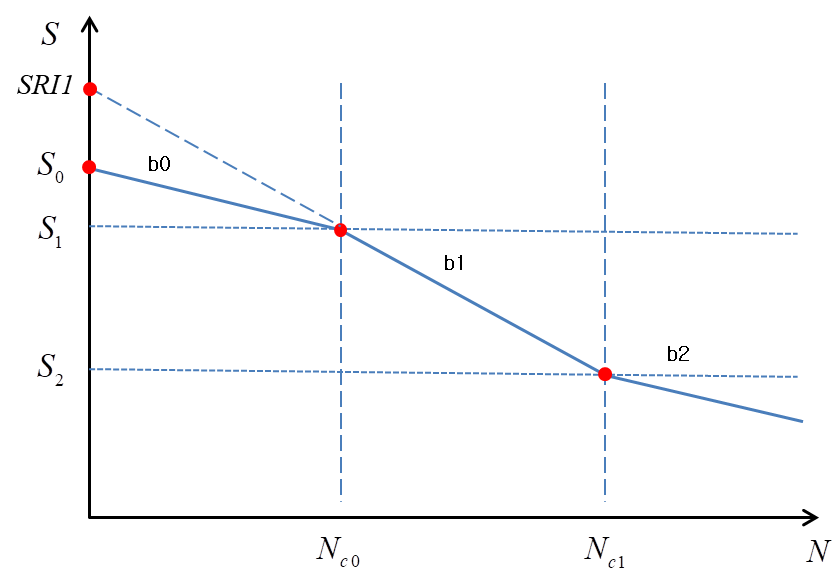
The SN curve can be developed from the SN material property using the following steps.
Figure 5.10: Parameters for SN Curve
| Step | Input Parameters | Calculated Output |
| 1 |  |
Where SRI1 is the intersection of b1 line and the stress axis. |
| 2 |  |
If then, |
| 3 |  |   |
| 4 |
 , ,  , , 
|  |


The SN curve can be developed from the EN material property using the following steps.
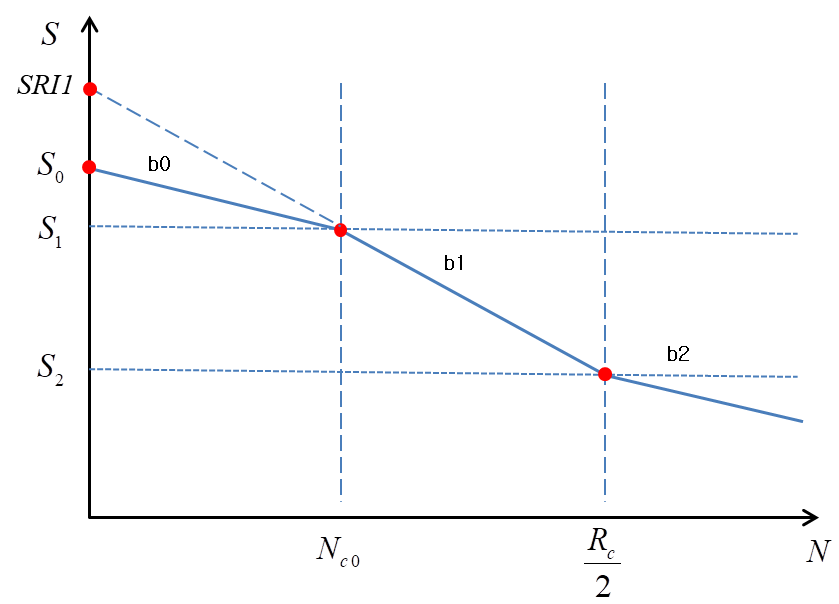
Figure 5.13: Parameters for SN Curve from EN Material Property
| Step | Input Parameters | Calculated Output |
| 1 | 
|
|
| 2 |  |  |
| 3 |  |
|
| 4 |  |
 = =  |
| 5 |
 , ,  , ,  |  |


The EN curve can be developed from EN material property as following steps.
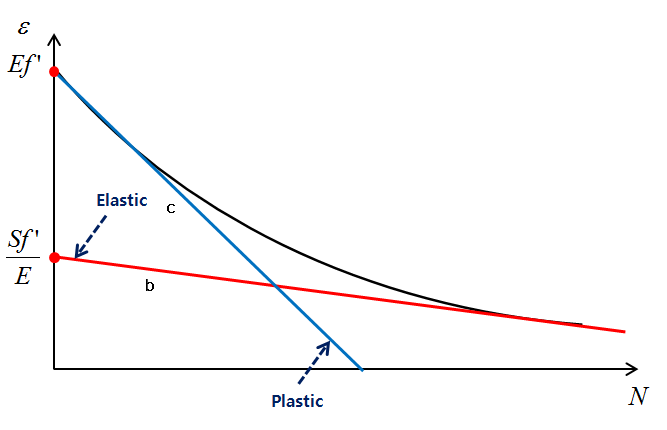
Figure 5.15: Parameters for EN Curve from EN Material Property
| Step | Input Parameters | Output |
| 1 |
 | Elastic Y intercept value =  Slope = |
| 2 |
 | Plastic Y intercept value =  Slope = |
| 3 |
E-N Curve is divided into elastic |


A real fatigue test is carried out with constant minimum and maximum stresses and this is known as a constant amplitude stress test. Stress range (𝚫σ) is the gap between max stress (σmax) and min stress (σmin). The median of these is known as the mean stress (σm). The mean stress of figure (a) is 0, (b)~(c) have mean stress. Stress amplitude (σa) is half of stress range.
Figure 5.16: Concept of repeated load
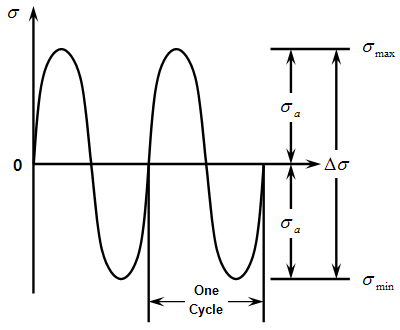 | 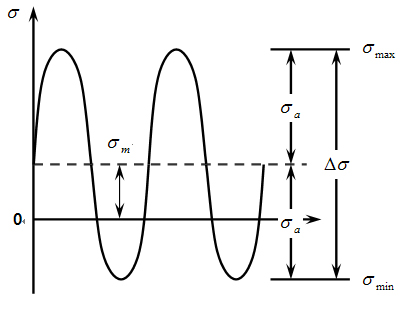 | 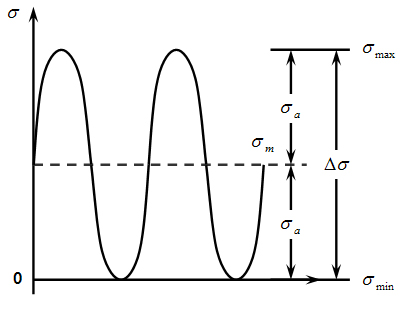 |
| (a)Perfect-alternating current | (b) Internal mean stress | (c)Internal repeated stress |
Formulas for these are as follows.


These formulas can be expressed by max stress and min stress as follows.


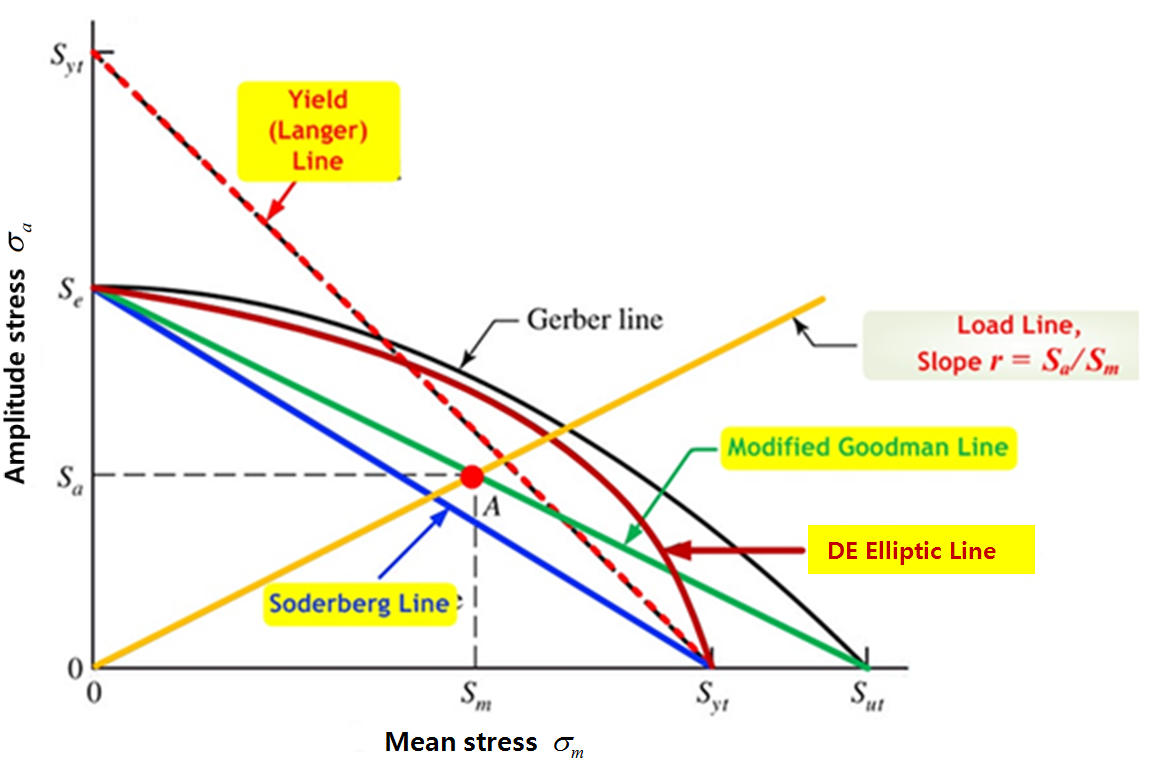
A general SN curve shows the life-cycle according to stress amplitude under zero mean stress conditions. Experimental relationships can be developed, taking into account the influence of mean stress. These relationships link the fatigue limit of alternation stress with one of yield strength, tension strength and breaking stress of alternation stress. If the analysis type is SN, select either , , , or . If analysis type is EN, select either , , or .
In SN analysis, the following formulae represent mean stress influence.
| Modified Goodman |  |
| Gerber Locus |  |
| Soderberg |  |
| DE elliptic |  |
 | Endurance strength |
 | Ultimate strength |
 | Yield strength |
In EN analysis, the following formulae represent mean stress influence.
| Morrow |  |
| S-W-T |  |
The S-W-T formula is undefined when  is a negative value.
The strain-life method is suitable for fatigue tests of low cycles that exhibit a large degree of plastic strain. The relationship between stress and plastic strain is non-linear. However, generally for a fatigue test, you should use a linear relationship. In fatigue life using the strain-life method, the formula for the total strain-stress relationship includes elastic strain and plastic strain.
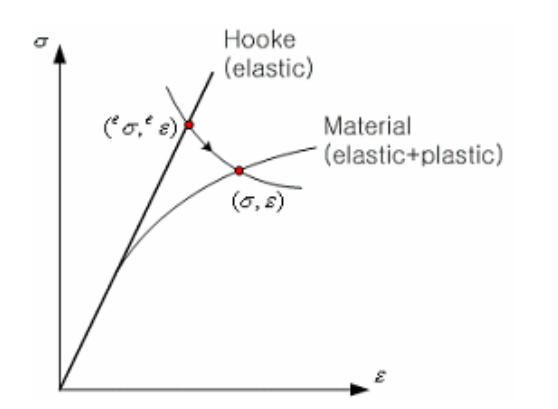
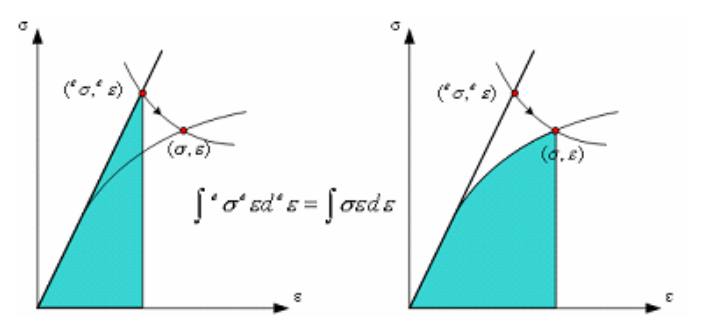
Neuber's law is the theory that the area created by the stress-elastic strain in Hooke's law and the area created by the total stress-strain in Ramberg-Osgood's law are same.
 → @
→ @ ,
,  are stress and strain in Hooke's law. When adapting
the formula for Ramberg-Osgood's law at @, as below.
are stress and strain in Hooke's law. When adapting
the formula for Ramberg-Osgood's law at @, as below.Ramberg-Osgood' formula →

 →
→ 
ESED (equivalent strain energy density) is the theory that strain energy by Hooke's law and total strain energy by Ramberg-Osgood's law is same.
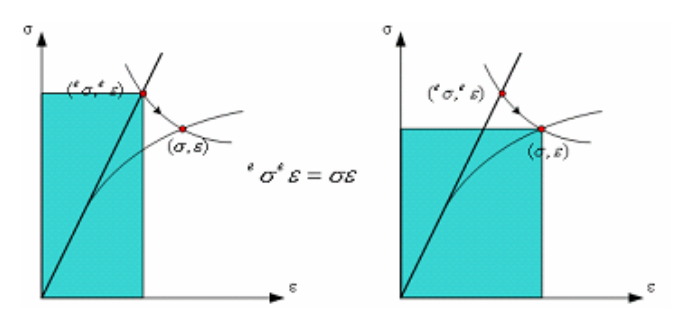

This formula is adapted from Ramberg-Osgood's formula.