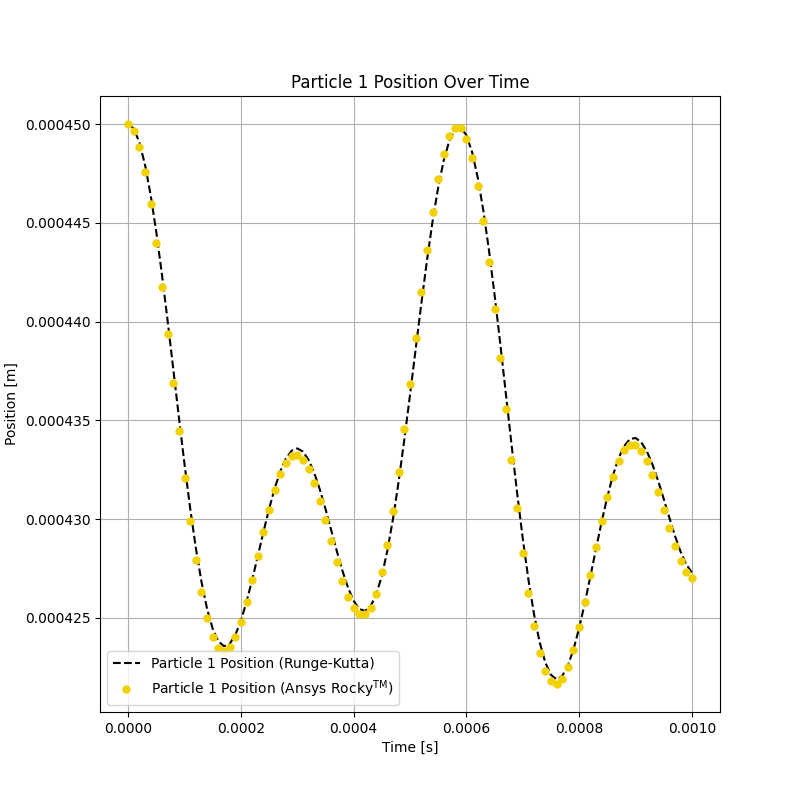
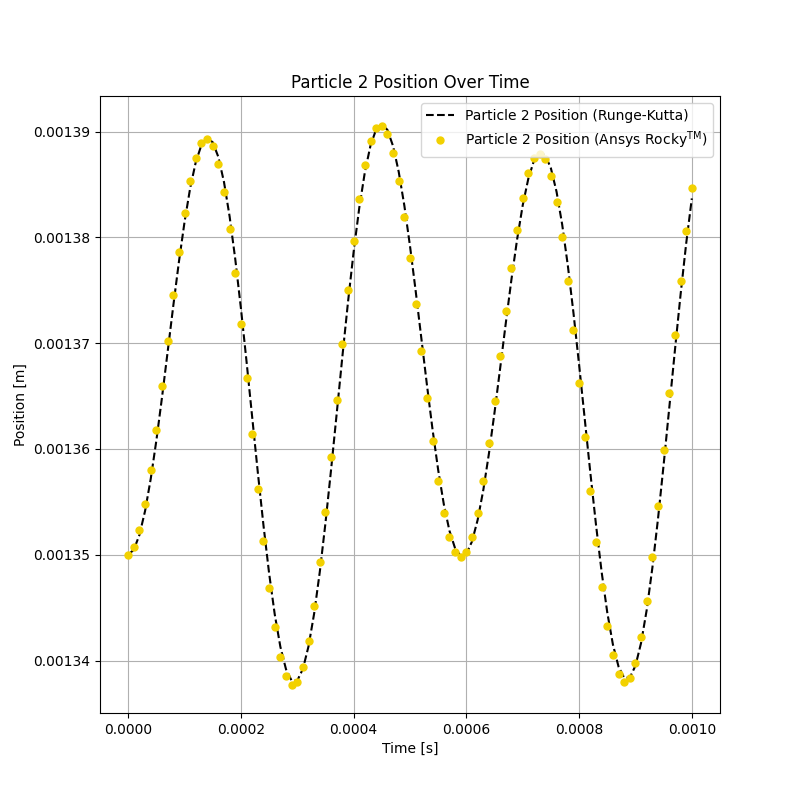
After running the simulations using the parameters described in the previous section, it is possible to compare the results between Rocky and the Runge-Kutta solution. The evolution of the particles positions (measured from their centers) is shown in Figure 2.25: Evolution of the position of particle 1 over simulation time. and Figure 2.26: Evolution of the position of particle 2 over simulation time..
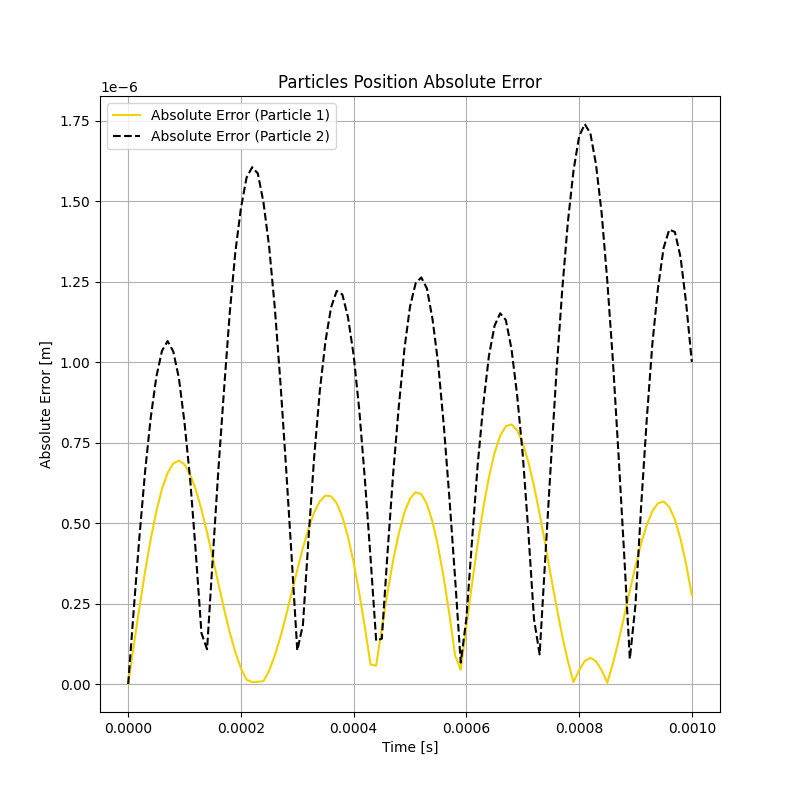
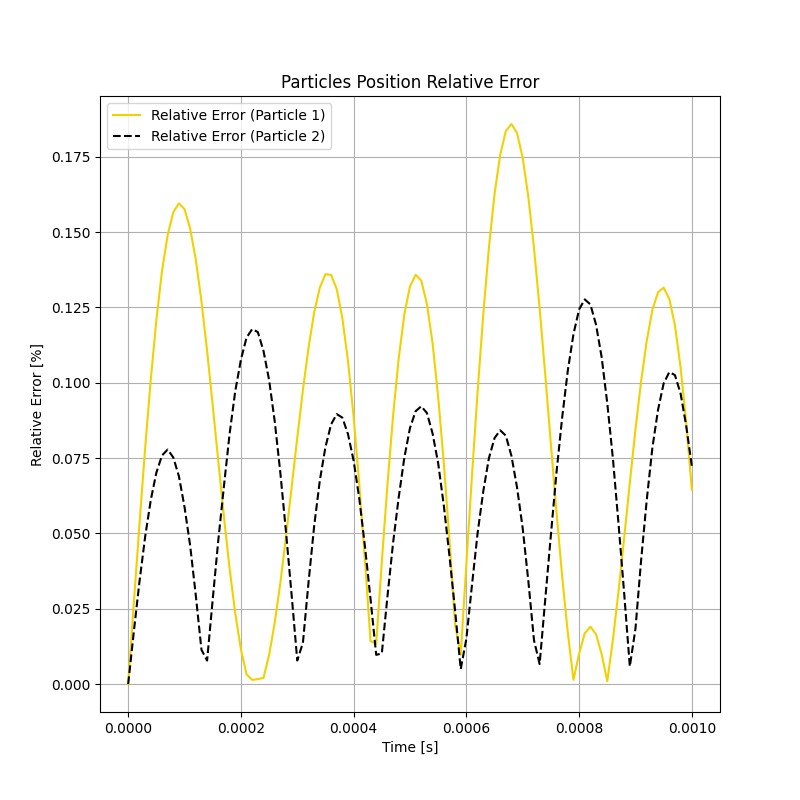
The absolute and relative errors for the particles positions are compared in Figure 2.27: Absolute error between Rocky and Runge-Kutta solution for the particles position. and Figure 2.28: Relative error between Rocky and Analytical solution for the particles position., respectively. The absolute error is maximum for particle 1 around 8.0E-07 m, representing a 0.18% relative error, while for particle 2 it is roughly 1.8E-06 m, representing a 0.13% relative error.